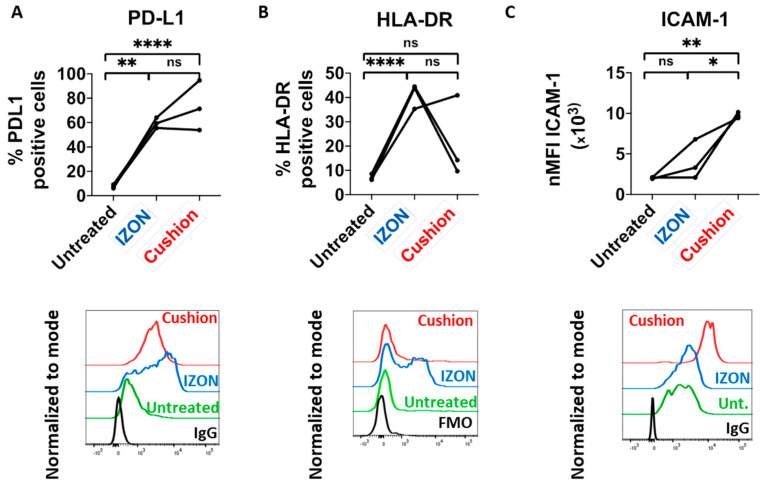
Figure 4.
Response of murine monocytes upon tumor-derived sEVs (TEX) treatment. Bone marrow-derived monocytes were treated with 5 µg of the indicated sEV preparations for 8 h and analyzed by flow cytometry gating on CD11b+F4/80++CX3CR1+Ly6C+ cells (n = 3 mice per sEV preparation). (A) Top: percentage of PD-L1 positive cells among CD11b+F4/80+CX3CR1+Ly6C+ monocytes. Bottom: representative histogram including isotype antibody staining as negative control (IgG). (B) Percentage of MHC-II/HLA-DR positive cells among CD11b+F4/80+CX3CR1+Ly6C+ monocytes. Bottom: representative histogram including fluorescence-minus-one (FMO) staining as negative control. (C) Top: ICAM-1/CD54 expression presented as normalized mean fluorescence intensity (nMFI). Bottom: representative histogram. p-values were determined by one-way ANOVA with Tukey’s multiple comparisons test. * p < 0.05; ** p < 0.0021; *** p < 0.0002; **** p < 0.0001.

