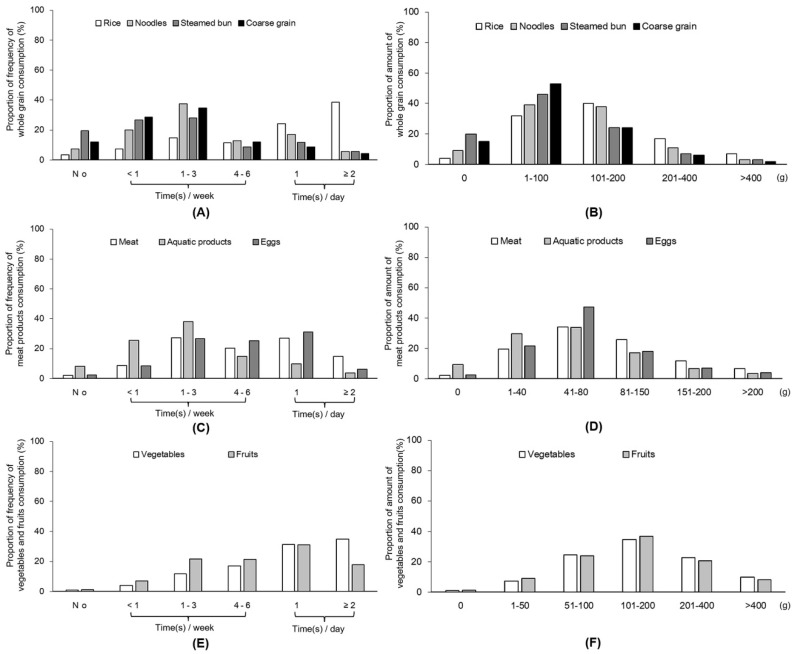
Figure 3.
Proportion of dietary consumption frequency and daily amount during the home-isolation period. (A) Consumption frequency of whole grain. (B) Daily amount consumption of whole grain (C) Consumption frequency of meat products. (D) Daily amount consumption of meat products. (E) Consumption frequency of vegetable and fruit. (F) Daily amount consumption of vegetable and fruit.

