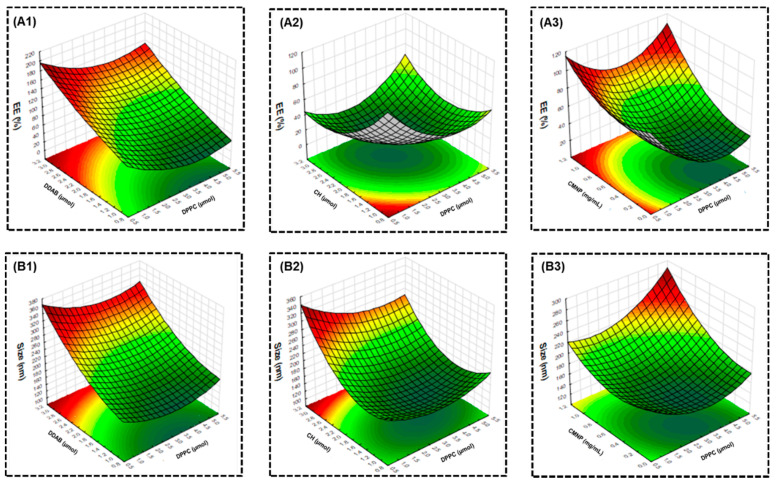
Figure 3.
Representative response 3D surface plots showing the effect of factors on the encapsulation efficiency (EE) of CMNPs (A1–A3) and size of MLs (B1–B3). The surface 3D contour plots were generated form the response model by varying two of the factors while keeping the other two factors constant, with the variables shown in Table 2.

