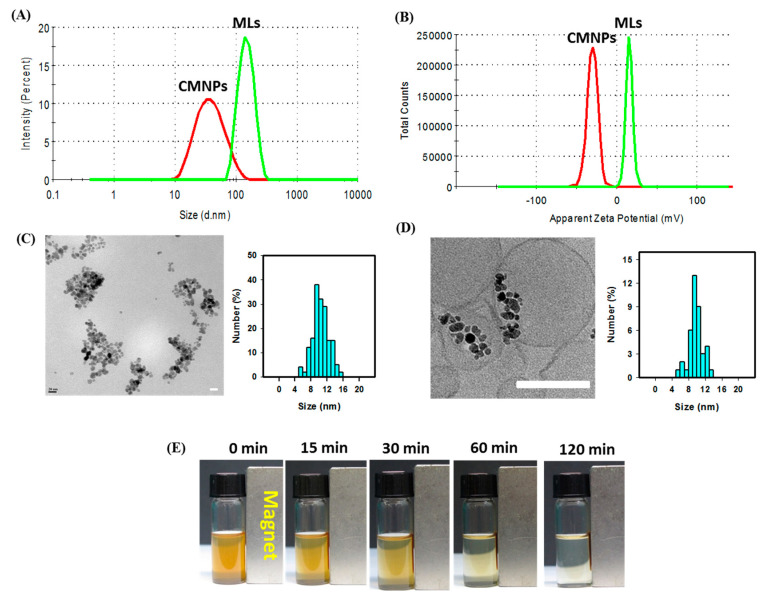
Figure 4.
The particle size distribution from the dynamic light scattering (DLS) (A) and zeta potential distribution (B) of CMNPs and MLs. The TEM image (bar = 20 nm) and histogram of CMNPs (C) and the cryo-TEM image of MLs (bar = 100 nm) and histogram of CMNPs in MLs (D). (E) The magnetic responsiveness of MLs.

