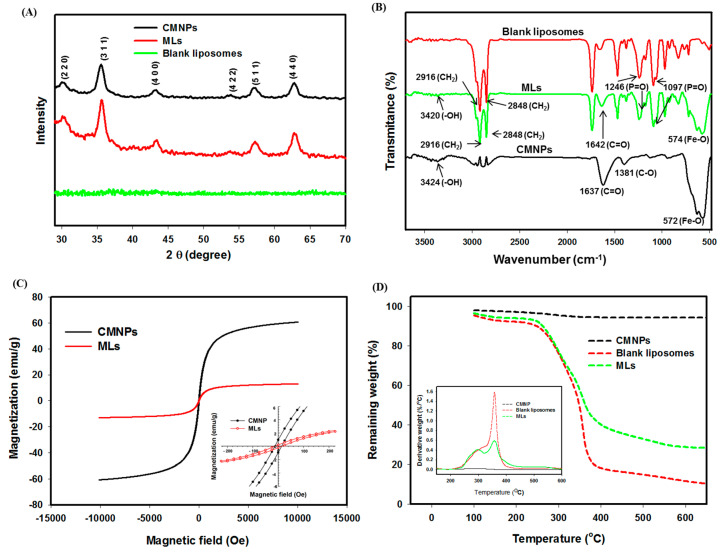
Figure 6.
(A) Characterization of CMNPs and MLs by X-ray diffraction (XRD) patterns. (B) The Fourier transform infrared (FTIR) spectra of CMNPs, MLs, and blank liposomes (MLs without CMNPs). (C) The superconducting quantum interference device (SQUID) magnetization curves of CMNPs and MLs, with the insert showing the coercivity and the remnant magnetization. (D) Thermogravimetric analysis (TGA) of CMNPs, MLs, and blank liposomes (MLs without CMNPs), with the insert showing the differential thermal analysis (DTA) curves.

