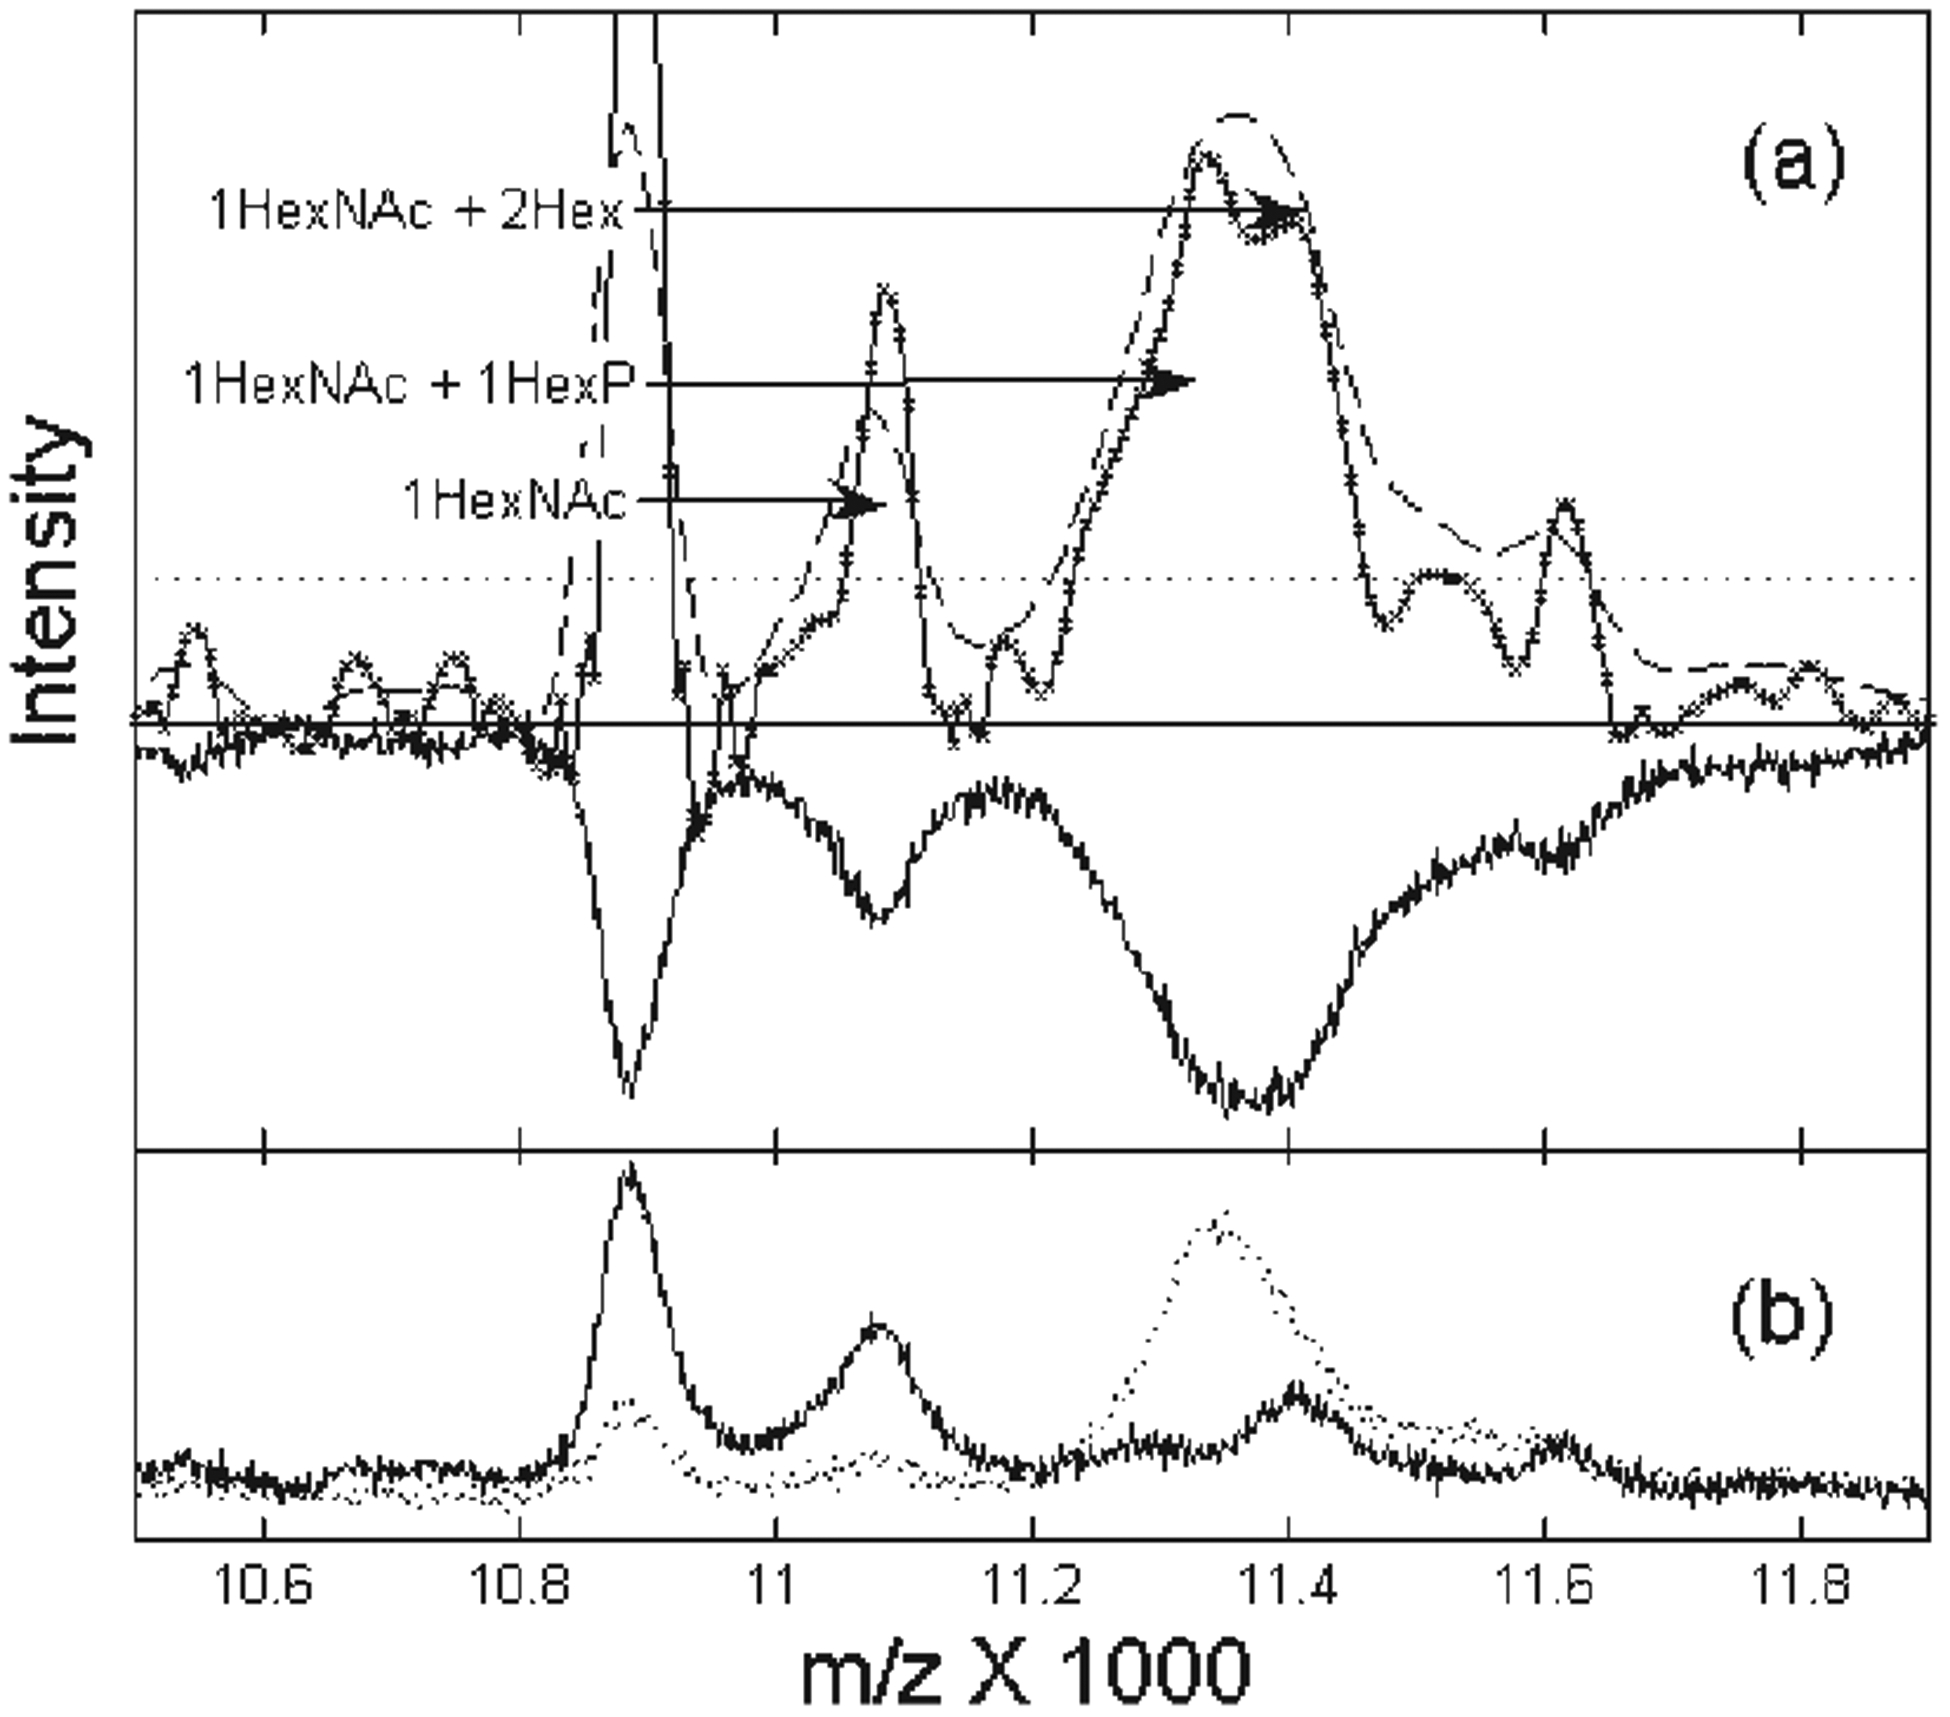
Figure 5.

Enhanced resolution resolves mass shifts consistent with different states of the phosphoryl-glycoconjugated protein cluster near m/z 11 000. In (a), the inverted spectrum is the average of the unprocessed spectra from the cell lysates of the two breast cancer groups on WCX2, shown separately in (b). The dashed curve is the results of the optimal linear filter; the solid curve is the result of the nonlinear filter. The arrows mark likely glycosylation states as described in the text. The dotted line shows the peak detection threshold based on the input noise level.
