
Figure 3.
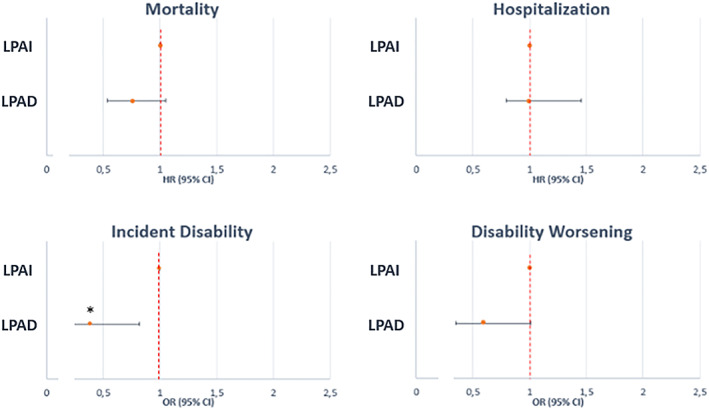
Forest plots of the differences in the risk of adverse outcomes between the low physical activity‐increasing and low physical activity‐decreasing trajectory groups. CI, confidence interval; HR, hazard ratio; OR, odds ratio. * P < 0.05; ** P < 0.01; *** P < 0.001. LPAD, low PA‐decreasing; LPAI, low PA‐increasing.