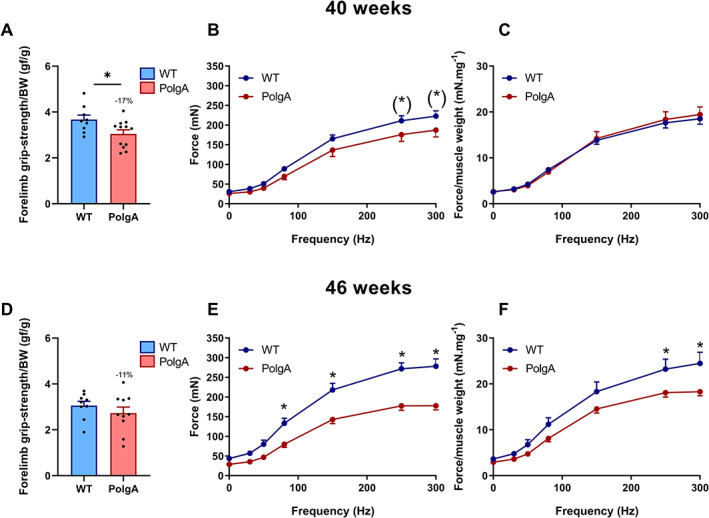
FIGURE 2.

Muscle phenotyping at 40 (upper row, A–C) and 46 weeks (lower row, D–F). (A,D) forelimb grip strength (n = 9–12/group). (B,E) force frequency at 1, 30, 50, 80, 150, 250, and 300 Hz. (C,F) force frequency relative to EDL muscle weight (n = 6–8/group). Data represent mean ± SEM; (*)P < 0.10, * P < 0.05 by Student's t‐tests (A–D) and two‐way ANOVA (E–H).
