
Figure 2.
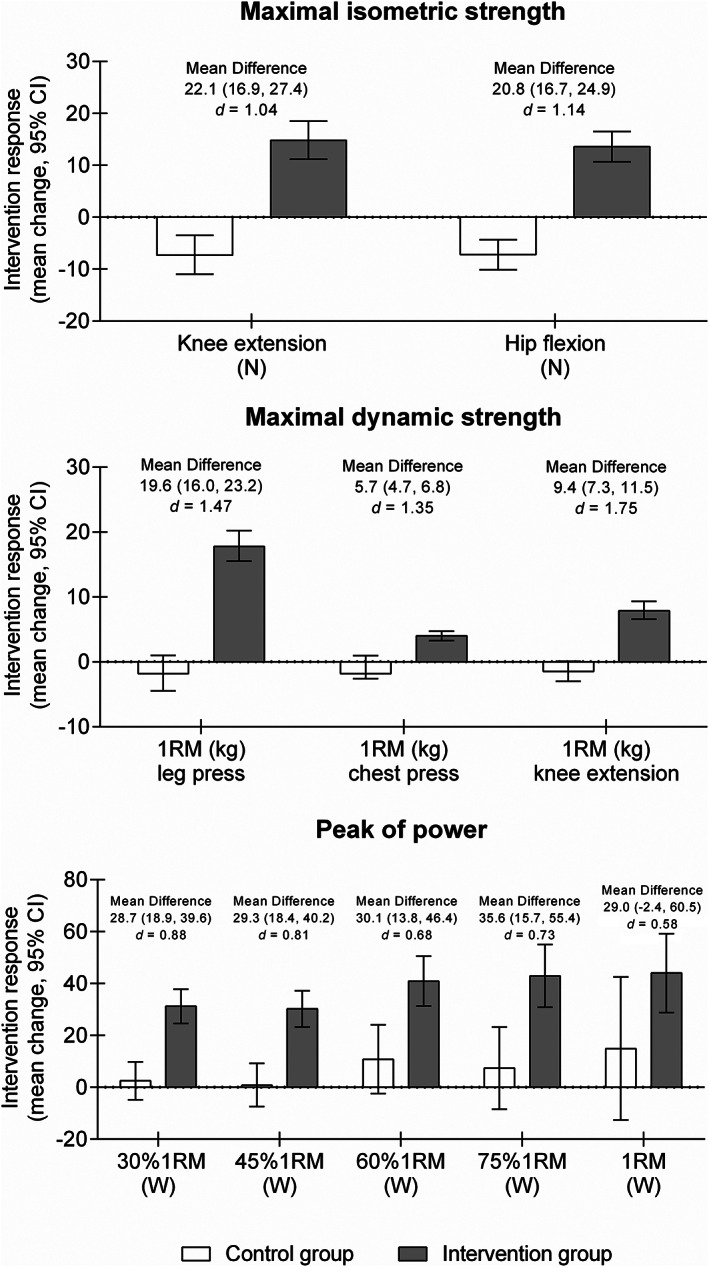
Changes in maximal muscle strength and muscle power for both groups. Mean difference corresponds to between‐group difference in each endpoint.
Official websites use .gov
A
.gov website belongs to an official
government organization in the United States.
Secure .gov websites use HTTPS
A lock (
) or https:// means you've safely
connected to the .gov website. Share sensitive
information only on official, secure websites.
Changes in maximal muscle strength and muscle power for both groups. Mean difference corresponds to between‐group difference in each endpoint.