
Figure 4.
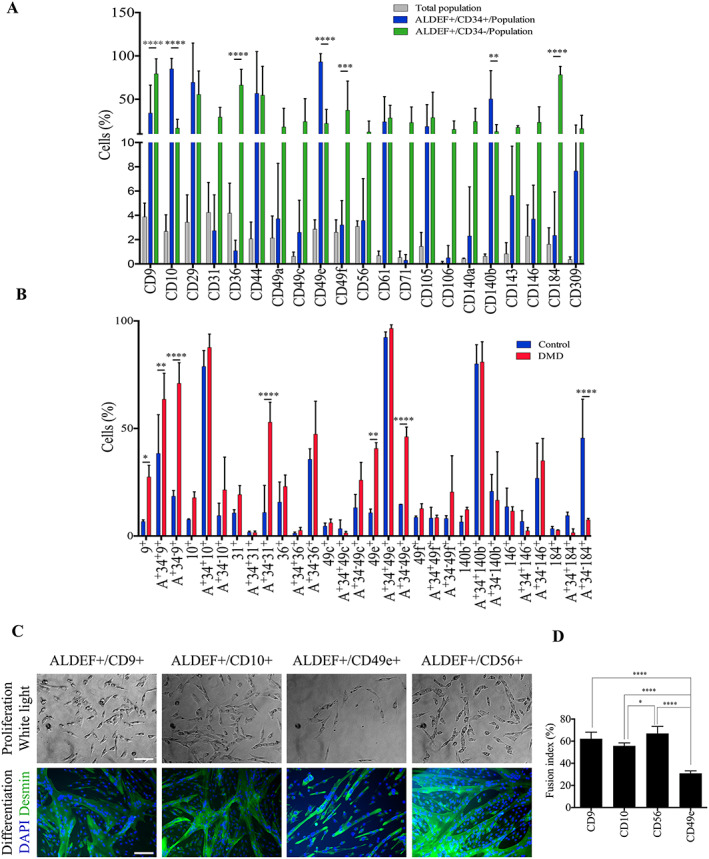
Identification of markers associated with ALDEF+ cell populations. Dissociated cells from human control TFL muscle biopsies were incubated with ALDEF substrate and then with APC‐labelled anti‐CD34 antibody and a second PE‐labelled marker. Histograms and data are percentages (mean, SD) of positive cells for the indicated markers. (A) Cell analyses from TFL muscles of healthy controls (n = 7). The proportion of a dedicated marker among the whole content of mononucleated cells is presented in grey. The percentages of cells expressing a dedicated marker within the ALDEF+/CD34+ population and within the ALDEF+/CD34− population are presented in blue and in green, respectively. This representation suggests that, for example, CD9 and CD184 are especially co‐expressed with ALDEF+/CD34− cells from skeletal muscles. (B) Comparison of some selected markers expressed by cells extracted from healthy (blue, n = 4) and DMD (red, n = 4) paravertebral muscles. For each marker, the three sub‐populations are individualized (all cells, ALDEF+/CD34+, and ALDEF+/CD34−). Significant differences were observed regarding DMD cell populations expressing CD9, CD31, and CD49e and healthy cell populations expressing CD184. The myogenic differentiation capacities of cells selected on the basis of these markers is compared (C and D). NHP muscle cells (n = 4 animals) were incubated with ALDEF substrate and then with APC‐labelled anti‐CD34 antibody and a second PE‐labelled marker—CD9 (n = 4), CD10 (n = 2), CD56 (n = 4), or CD49e (n = 4)—and then sorted using a FACSDiva. The selected populations were grown in culture in proliferating medium for two passages (C, left) and then differentiated, fixed, and labelled for desmin expression (green) and DAPI staining (blue) (C, right). Fusion indexes were calculated (n = 4 fields per well) (D). Cells selected on CD9 and CD56 were the most myogenic, while cells selected on CD49e were significantly less myogenic (P < 0.01) (bottom panel). Data are presented as mean and SD. Two‐way ANOVA with Sidak's multiple‐comparison test was applied (A and B) and one‐way ANOVA with Tukey's multiple‐comparison test (C; *P ≤ 0.05, **P ≤ 0.01, ***P ≤ 0.001, and ****P ≤ 0.0001).