
Figure 4.
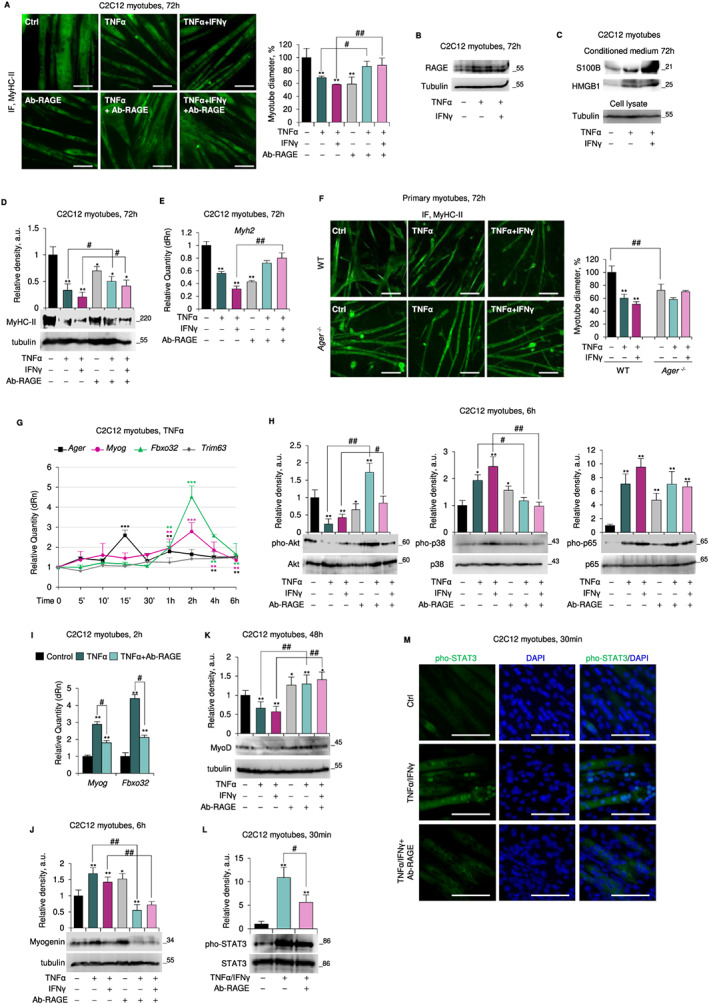
Receptor for advanced glycation end‐products (RAGE) signalling is required for tumour necrosis factor (TNF)α ± interferon (IFN)γ‐induced reduction of myotube size. (A–E, G–M) Myotubes obtained by culturing C2C12 myoblasts in differentiation medium (DM) for 4 days were added with TNFα (20 ng/ml) ± IFNγ (100 U/ml) in absence and presence of a RAGE blocking antibody (Ab‐RAGE) (10 μg/ml) for the indicated time. (A) Myosin heavy chain (MyHC)‐II expression was analysed by immunofluorescence (IF). Reported are the percentages of myotubes diameters compared with control. (B) RAGE expression was evaluated by western blot (WB). (C) The conditioned media of TNFα ± IFNγ‐treated myotubes were processed for detection of released S100 calcium‐binding protein B (S100B) and high mobility group box 1 (HMGB1) by WB. The tubulin is relative to cell lysates from which the media are derived. (D,E) levels of MyHC‐II protein and messenger RNA (mRNA) were evaluated by WB (D) and real‐time PCR (E). (F) Myotubes obtained from primary myoblasts from wild type (WT) or Ager −/− mice were treated with TNFα ± IFNγ to analyse MyHC‐II expression. (G) Levels of Ager, Myog, Fbxo32, and Trim63 were analysed by real‐time PCR. (H) Total and phosphorylated protein kinase B (Akt), p38 mitogen‐activated protein kinase (MAPK), and p65 levels were analysed by western blot (WB). (I) Levels of Myog and Fbxo32 were evaluated by real‐time PCR. (J,K) Myogenin (J) and myoblast determination protein 1 (MyoD) (K) expression was evaluated by WB. (L,M) the expression and localization of total and phosphorylated signal transducer and activator of transcription 3 (STAT3) were studied by WB (L) and IF (M). Reported are the relative densities with respect to tubulin or total form of phosphorylated protein (D,H,J–L). Results are means ± standard error of the mean (SEM) (A,F) or standard deviation (SD) (D,E,G–L). Statistical analysis was conducted using the two‐tailed t‐test. * P < 0.05, ** P < 0.01, and ***P<0.001, significantly different from internal control. # P < 0.05 and ## P < 0.01, significantly different. Scale bars (A,F,M), 100 μm. See also Figure S6 ,7.