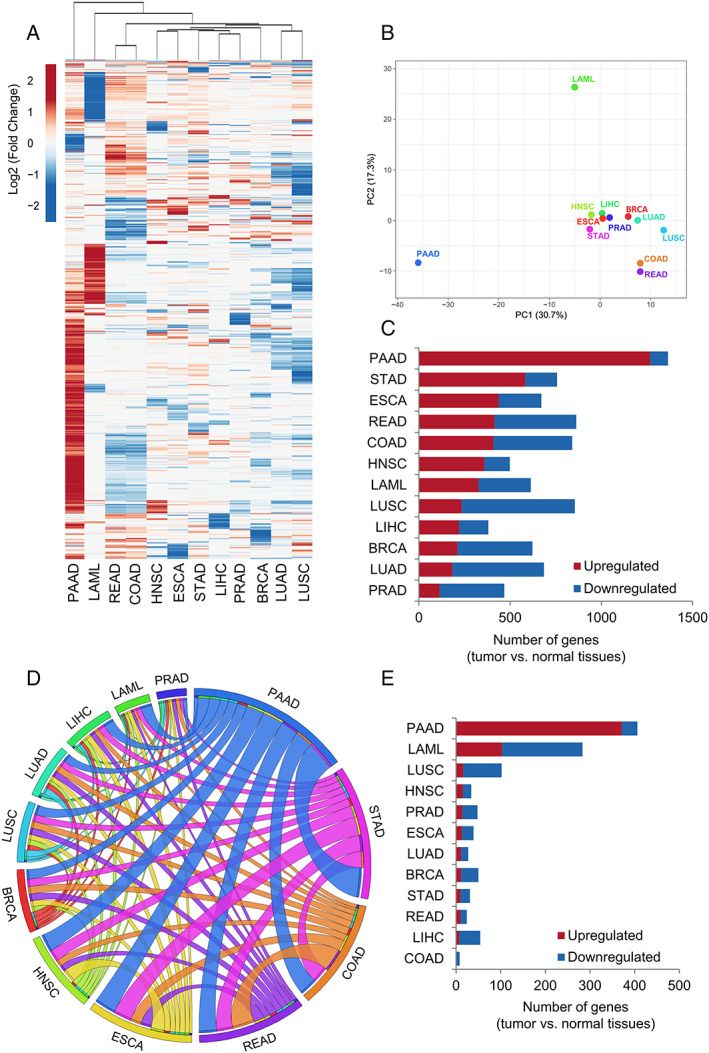
Figure 1.

Gene expression analysis of the secretome components in 12 tumour types of The Cancer Genome Atlas (TCGA) compared with corresponding matched normal TCGA and Genotype‐Tissue Expression (GTEx) tissues. (A) Heat map of the mean expression levels [log2 (TPM + 1)] of secretome components in 12 tumour types compared with normal tissues. Both rows (secretome genes) and columns (tumour types) were clustered using Euclidian distance. Differential expression levels were calculated using the web‐based tool Gene Expression Profiling Analysis (http://gepia.cancerpku.cn/).32 The resulting numbers of genes encoding predicted that secreted proteins were filtered based on the Human Protein Atlas secretome data (https://www.proteinatlas.org/humanproteome/secretome).27 The upregulated and downregulated genes with absolute values of fold change > 2.0 and q value < 0.01 (ANOVA) are shown in red and blue, respectively. PAAD shows a clear enrichment of the upregulated secretome genes. (B) Principal component analysis of the secretome gene expression data in 12 tumour types compared with normal tissues. (C) The total number of dysregulated secretome genes in each tumour type (TCGA) compared with corresponding matched normal tissues (TCGA and GTEx). (D) The thickness of each link in the Circos plot represents the number of shared upregulated secretome genes among tumour types. (E) Exclusive upregulated genes within tumour types. BRCA, breast invasive carcinoma; COAD, colon adenocarcinoma; ESCA, oesophageal carcinoma; HNSC, head and neck squamous cell carcinoma; LAML, acute myeloid leukaemia; LIHC, liver hepatocellular carcinoma; LUAD, lung adenocarcinoma; LUSC, lung squamous cell carcinoma; PAAD, pancreatic adenocarcinoma; PRAD, prostate adenocarcinoma; READ, rectum adenocarcinoma; STAD, stomach adenocarcinoma.
