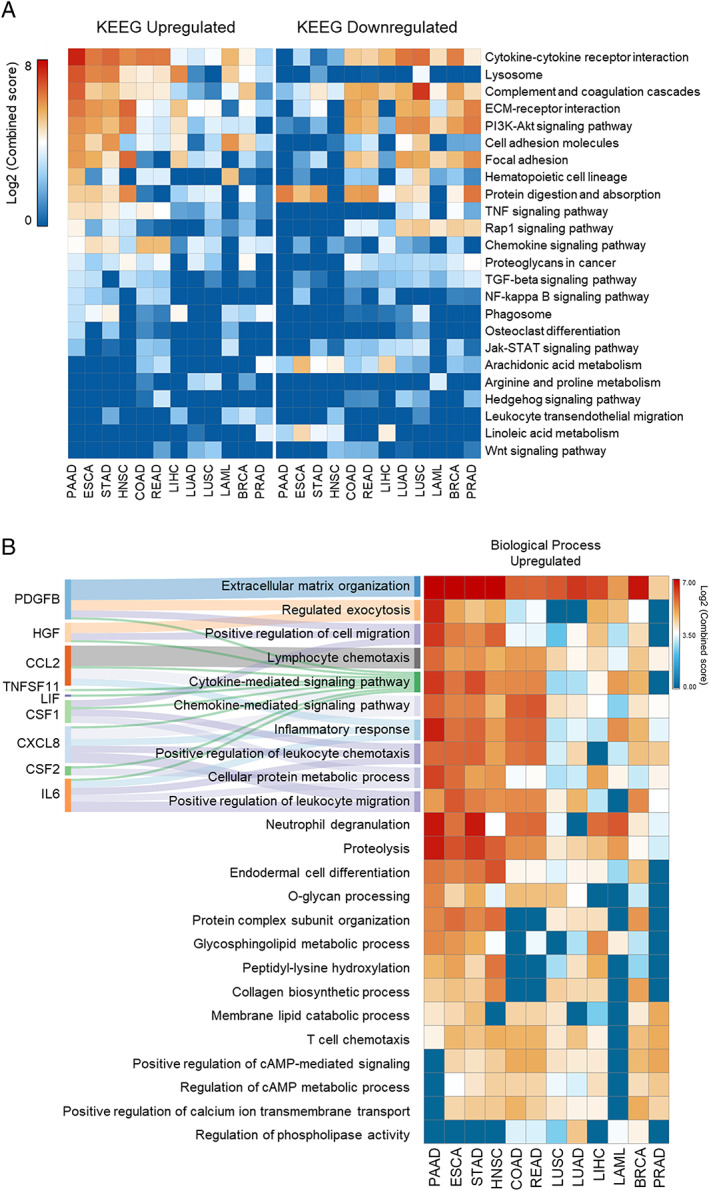
Figure 2.

Enriched pathways of the differentially expressed secretome genes. (A) Top‐ranked combined scores for The Kyoto Encyclopedia of Genes and Genomes pathway categories associated with upregulated (right panel) and downregulated (left panel) genes in tumour tissues vs. corresponding matched normal tissues of The Cancer Genome Atlas (TCGA) and Genotype‐Tissue Expression (GTEx), computed by the gene set enrichment analysis tool EnrichR.36, 37 Pathways were included in the analysis when satisfying the criteria of over‐representation (log2 combined score > 2) in, at least, one tumour type (colour intensity codes for combined score). Rows and columns were clustered based on Euclidean distance between log2 combined score values. (B) Right: Top‐ranked combined scores for Gene Ontology categories associated with upregulated genes in tumour tissues vs. corresponding matched normal TCGA and GTEx tissues, computed by the gene set enrichment analysis tool EnrichR.36, 37 Left: alluvial diagram connecting the cachexia‐inducing factors predicted into those biological processes terms. BRCA, breast invasive carcinoma; COAD, colon adenocarcinoma; ESCA, oesophageal carcinoma; HNSC, head and neck squamous cell carcinoma; LAML, acute myeloid leukaemia; LIHC, liver hepatocellular carcinoma; LUAD, lung adenocarcinoma; LUSC, lung squamous cell carcinoma; PAAD, pancreatic adenocarcinoma; PRAD, prostate adenocarcinoma; READ, rectum adenocarcinoma; STAD, stomach adenocarcinoma.
