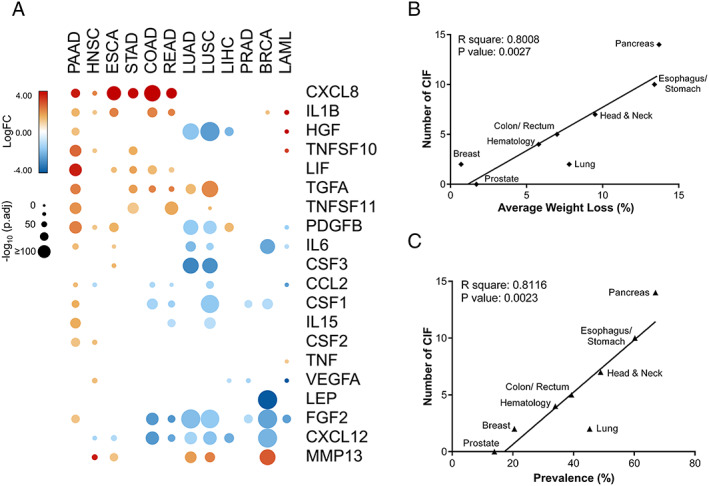
Figure 3.

Cachexia‐inducing factors (CIFs) tumour‐specific expression profiles strongly correlate with the prevalence of cachexia and weight loss in different tumour types. (A) Schematic representation of the expression pattern of 25 CIFs in different tumour types of The Cancer Genome Atlas (TCGA). Differential expression levels were calculated using the web‐based tool Gene Expression Profiling Analysis (http://gepia.cancerpku.cn/)32 from tumour tissues vs. matched normal TCGA and Genotype‐Tissue Expression (GTEx) data. Upregulated and downregulated genes with absolute values of fold change > 2.0 and q value < 0.01 (ANOVA) are shown in red and blue, respectively. Five molecules (IL10, CD40LG, IFNA1, IL4, and IL17A) showed no alteration and are not represented in the heat map. (B–C) Pearson's correlations coefficient (r) with corresponding P values for the covariation between the number of differentially expressed CIFs (y‐axis) from TCGA data sets (tumour tissues vs. matched normal TCGA and GTEx data) and the percentage of weight loss (x‐axis; B) or the percentage of cachexia prevalence (x‐axis; C) for specific tumour types from relevant literature data.8, 11, 12 Weight loss and prevalence of cachexia are strongly correlated with the number of CIFs (P < 0.01). BRCA, breast invasive carcinoma; COAD, colon adenocarcinoma; ESCA, oesophageal carcinoma; HNSC, head and neck squamous cell carcinoma; LAML, acute myeloid leukaemia; LIHC, liver hepatocellular carcinoma; LUAD, lung adenocarcinoma; LUSC, lung squamous cell carcinoma; PAAD, pancreatic adenocarcinoma; PRAD, prostate adenocarcinoma; READ, rectum adenocarcinoma; STAD, stomach adenocarcinoma.
