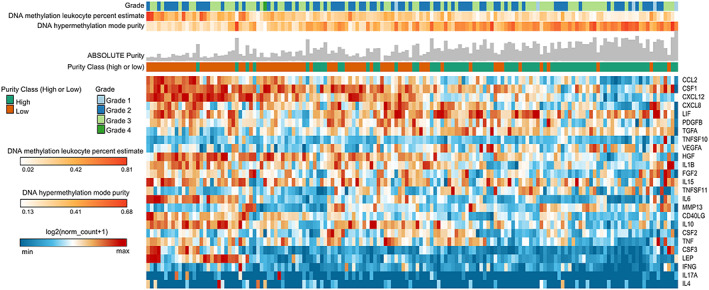
Figure 4.

Landscape of cachexia‐inducing factors is associated with low tumour purity. Unsupervised hierarchical clustering of cachexia‐inducing factors is presented in a heat map according to gene expression (log2 norm_count + 1). The integrated epigenomic data for PAAD samples, including DNA hypermethylation mode purity and DNA methylation leucocyte percent, are shown as tracks at the top together with the tumour grade. The absolute tumour purity data for each sample are shown as grey bars at the top. The percentage of patients classified as low or high purity is noted as orange and green tracks, respectively. Rows and columns were clustered based on Euclidean distance between log2 norm_count + 1 values.
