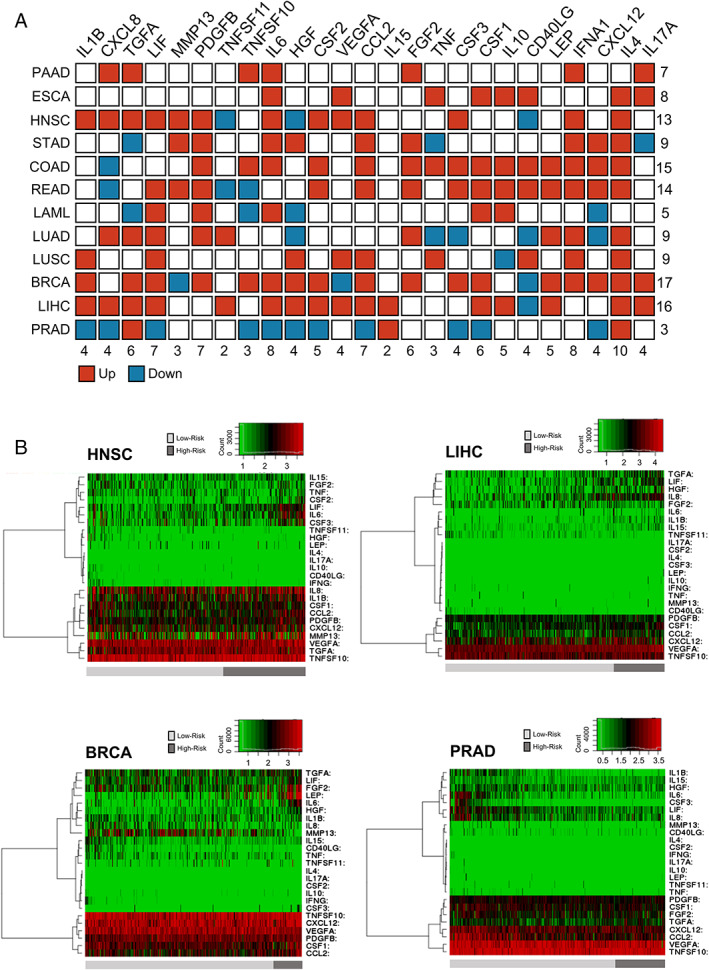
Figure 5.

High‐risk groups are correlated with high expression of cachexia‐inducing factors (CIFs) in tumour tissues. (A) Schematic representation summarizing the expression pattern of 25 CIFs in 12 tumour types of The Cancer Genome Atlas (TCGA). Differential expression levels were calculated in the web‐based tool SurvExpress40 by maximizing two risk groups (high risk and low risk) by prognostic index median and Cox fitting. The statistical difference for each messenger RNA expression between high‐risk and low‐risk groups was tested using the t‐test. Upregulated and downregulated genes (high risk vs. low risk) with P value < 0.05 are shown in red and blue, respectively. (B) Representative heat maps are showing the hierarchical clustering analysis of tumour messenger RNA expression of 25 CIFs generated in SurvExpress,40 using TCGA data sets. This analysis demonstrates the considerable variation in tumour expression of some CIFs according to risk groups in HNSC, LIHC, BRCA, and PRAD. The cancer patients were stratified into high‐risk and low‐risk groups, indicated below each heat map as dark‐grey and light‐grey bars, respectively. Risk groups were maximized based on the Prognostic Index assessed by gene expression values multiplied by beta coefficients. BRCA, breast invasive carcinoma; COAD, colon adenocarcinoma; ESCA, oesophageal carcinoma; HNSC, head and neck squamous cell carcinoma; LAML, acute myeloid leukaemia; LIHC, liver hepatocellular carcinoma; LUAD, lung adenocarcinoma; LUSC, lung squamous cell carcinoma; PAAD, pancreatic adenocarcinoma; PRAD, prostate adenocarcinoma; READ, rectum adenocarcinoma; STAD, stomach adenocarcinoma.
