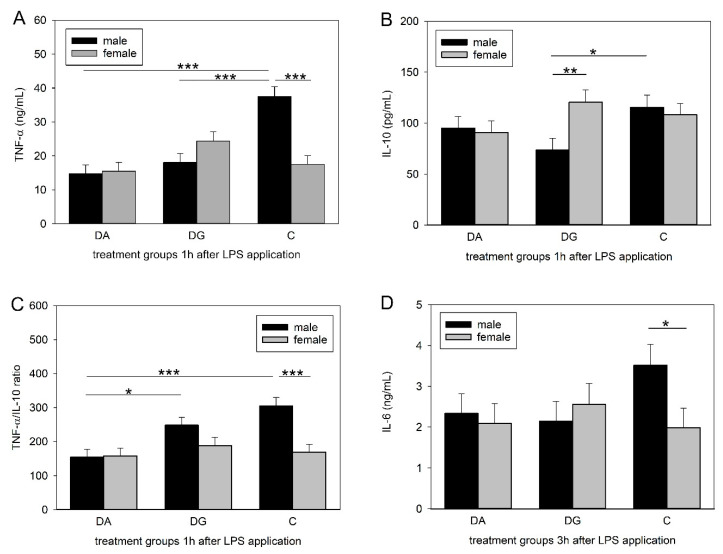
Figure 3.
Plasma concentrations of TNF-α (A) and IL-10 (B) and the TNF-α/IL-10 ratio (C) 1 h after LPS application and plasma concentration of IL-6 (D) 3 h after LPS application in male and female piglets of the three treatment groups of DA (deprivation alone), DG (deprivation with a group of littermates) and C (control, no deprivation). Significant differences are indicated by asterisks (* p < 0.05; ** p < 0.01; *** p < 0.001; n = 8 pigs per treatment group and sex).

