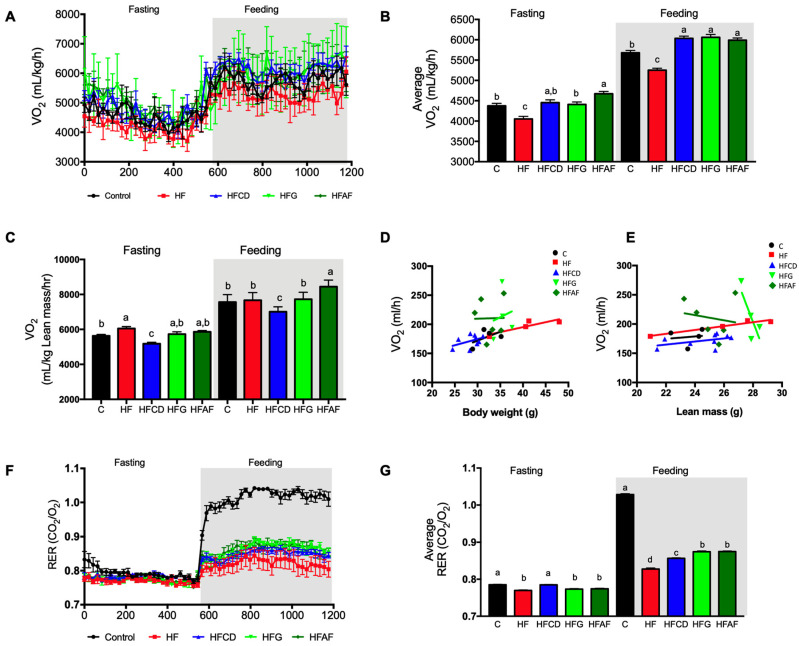
Figure 3.
Whole-body energy expenditure and substrate oxidation. (A,B) Oxygen consumption (VO2) normalized to body weight and to (C) lean mass, during fasting and feeding periods determined by indirect calorimetry analysis; clear and shaded zones indicate fasting and feeding periods, respectively. (D,E) Regression plot comparing oxygen consumption (VO2) as a function of body weight or lean mass, respectively. (F) Respiratory exchange ratio (RER) and (G) Average RER during fasting and feeding periods. Indirect calorimetry was performed in mice fed control diet (control), a high-fat diet (HF) or a high-fat diet with milk from goats fed a conventional diet (HFCD), from goats grazing (HFG) or from goats fed a CD supplemented with Acacia farnesiana pods (HFAF). Results are presented as the mean ± S.E.M., n = 6 mice per group and analyzed by one-way ANOVA followed by Tukey multiple comparison post hoc test. The differences were considered statistically significant at p < 0.05. Mean values with different lowercase letters show statistical differences between each other.

