Figure 1.
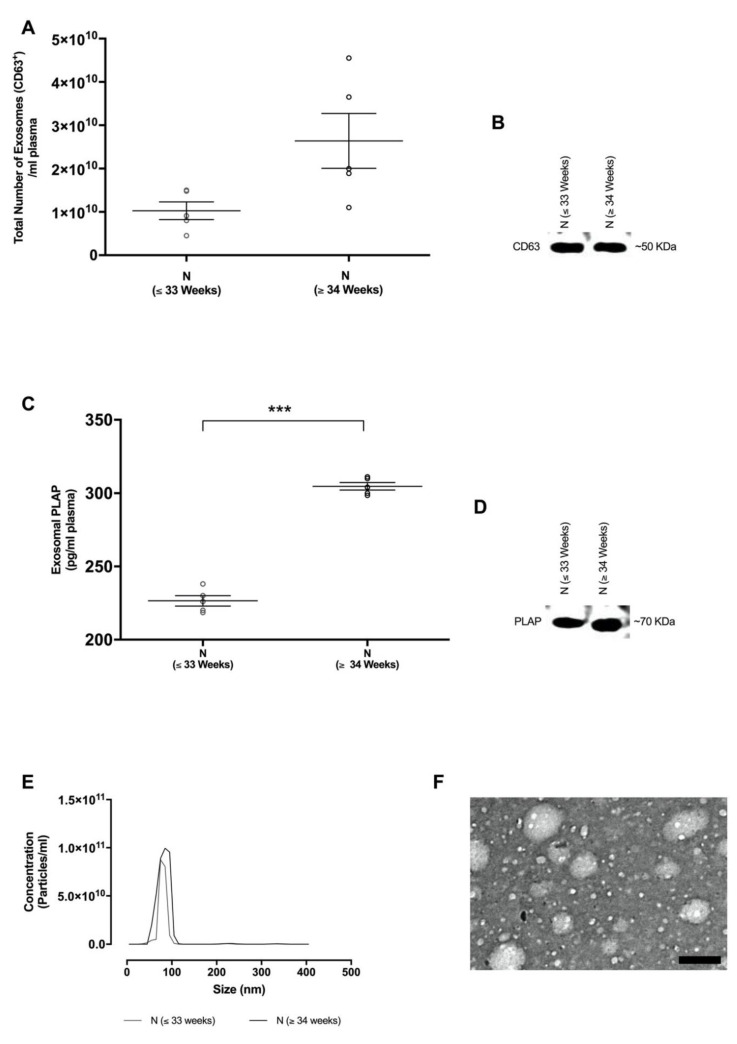
Identification and characterisation of exosomes from normotensive pregnant women. (A) Total exosome concentration was determined by the quantification of the exosomal CD63 marker per mL of plasma using ELISA. (B) Western blot analysis for the CD63 exosome enriched marker. (C) Placenta-derived exosomes (i.e., exosomal placental alkaline phosphatase (PLAP) was quantified per mL of plasma by ELISA. (D) Western blot analysis for the exosomal PLAP marker. (E) Nanoparticle tracking analysis (NTA) illustrating the representative vesicle size distribution (nm). (F) Electron micrograph of isolated exosomes, scale bar 100 nm. In A,C, the data are expressed as aligned dot plots and values are mean ± SEM. *** p < 0.0001 N (≤33 weeks) vs. N (≥34 weeks).

