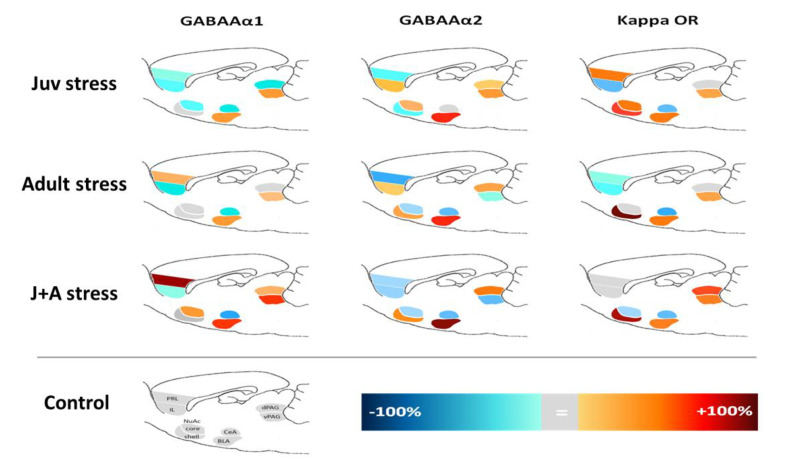
Figure 5.
A combined map of γ-Aminobutyric acid type A (GABAA) and κ-opioid receptors (KOR) expression in a fear memory-related network of regions: Warm colors represent a positive shift from control group values, while cold colors represent a negative shift. The gray color represents no differences from the control. PRL, prelimbic; IL, infralimbic; NuAc, nucleus accumbens; CeA, central amygdala; BLA, basolateral amygdala; PAG, periaqueductal gray. (Control: n = 13; juv stress: n = 11; adult stress: n = 13; and J + A stress: n = 14.)

