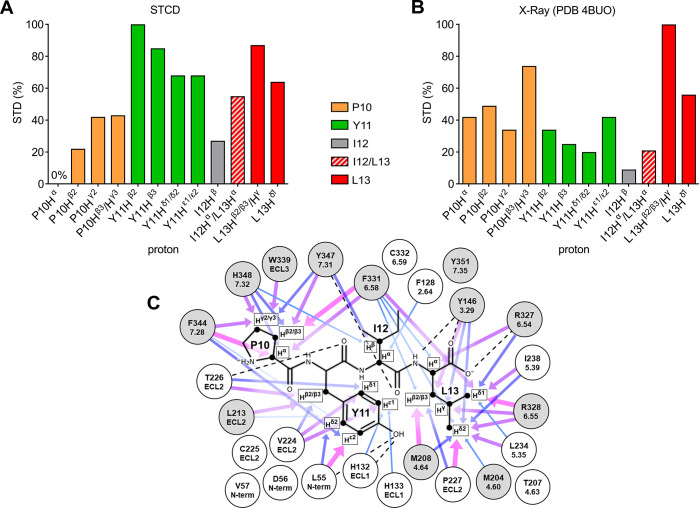
Figure 2.
Comparison of experimental and crystal structure-derived epitope maps. (A) Experimental epitope map based on the STCD experiment. The corresponding values are P10 Hα, 0%; P10 Hβ2, 22%; P10 Hγ2, 42%; P10 Hβ2/γ3, 43%; Y11 Hβ2, 100%; Y11 Hβ3, 85%; Y11 Hδ1/δ2, 68%; Y11 Hε1/ε2, 68%; I12 Hβ, 27%; I12 Hα/L13 Hα, 55%; L13 Hβ2/β3/Hγ, 87%; and L13 Hδ1, 64%. (B) Epitope map generated using theoretical STD enhancements calculated based on a NTS1 crystal structure (PDB 4BUO, chain A). The corresponding values are P10 Hα, 42%; P10 Hβ2, 49%; P10 Hγ2, 34%; P10 Hβ3/γ3, 74%; Y11 Hβ2, 34%; Y11 Hβ3, 25%; Y11 Hδ1/δ2, 20%; Y11 Hε1/ε2, 42%; I12 Hβ, 9%; I12 Hα/L13 Hα, 21%; L13 Hβ2/β3/Hγ, 100%; and L13 Hδ1, 56%. (C) Schematic representation of residues (sequential and Ballesteros-Weinstein numbering) within 5 Å of protons used to generate the theoretical 4BUO (chain A) epitope map (Figure 2B). Arrows represent individual contributions to STD enhancements as a function of interproton distances ranging from 2.27–3 Å (thick arrows, magenta) to 4–4.5 Å (thin arrows, lightblue). Dotted lines represent hydrogen bonds. Gray circles represent residues resulting in loss of NT8-13 binding affinity when mutated to other residue types.41−43 Data sets for epitope mapping (panels A and B) were normalized to the largest value of each set.

