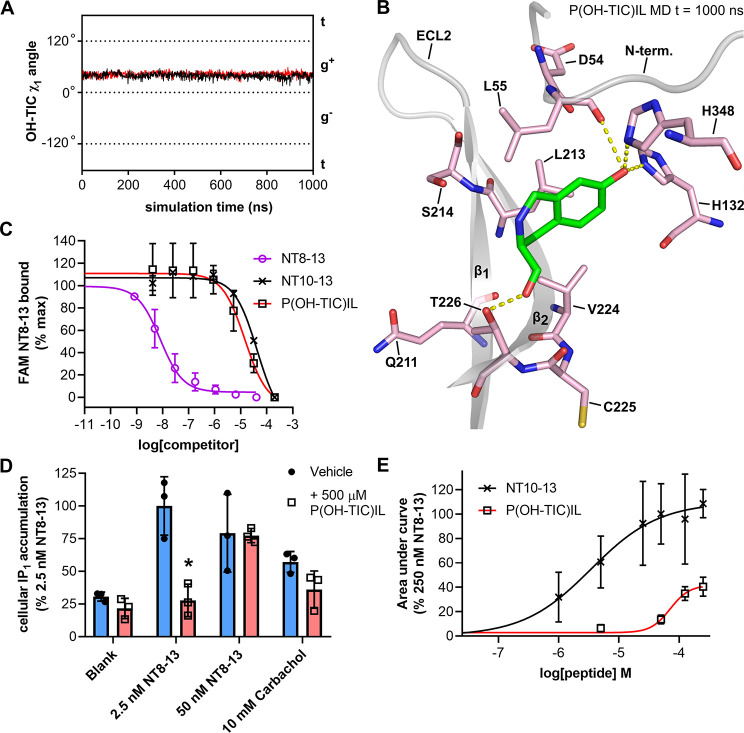
Figure 5.
Conformationally restrained P(OH-TIC)IL peptide. (A) Rotamer χ1 angle of Y11 in MD simulations of P(OH-TIC)IL (black trace) and RRP(OH-TIC)IL (red trace) bound to enNTS1model. (B) Snapshot taken at 1000 ns from the MD trajectory of P(OH-TIL)IL bound to enNTS1model showing OH-TIC. Other ligand residues and enNTS1 residues not interacting with OH-TIC or Y11 in the χ1 g+ conformation (Figure 4D) were omitted for clarity. (C) FAM-NT8-13 competition binding to HEK 293-T cells expressing WT rNTS1. Four nM FAM-NT binding was competed with increasing concentrations of NT8-13 (purple open circles), NT10-13 (black crosses), and P(OH-TIC)IL (black open squares). Values reported represent the mean and standard deviation (SD) from three independent experiments (n = 3). (D) IP1 accumulation assay on HEK-293T cells expressing WT rNTS1. Cells were treated with either vehicle (blank), 2.5 nM NT8-13, 50 nM NT8-13, or 10 mM Carbachol in the absence (blue bars and solid black circles) or presence (red bars and open black squares) of 500 μM P(OH-TIC)IL. Values reported represent the mean and standard deviation (SD) of three independent experiments. (E) xCELLigence dose response curves for NT10-13 (black crosses and black curve) and P(OH-TIC)IL (black open squares and red curve) at HEK 293T cells transfected with WT hNTS1. xCELLigence assays measure the impedance changes (cell index or CI) that cells impart over time on gold electrode-embedded microplates when treated with ligands. Area under the curve values were extracted from xCELLigence CI traces such as those in Figure S14 and normalized to the area under the curve given by 250 nM NT8-13 (100%). Values reported represent the mean and standard deviation (SD) of three independent experiments (n = 3).

