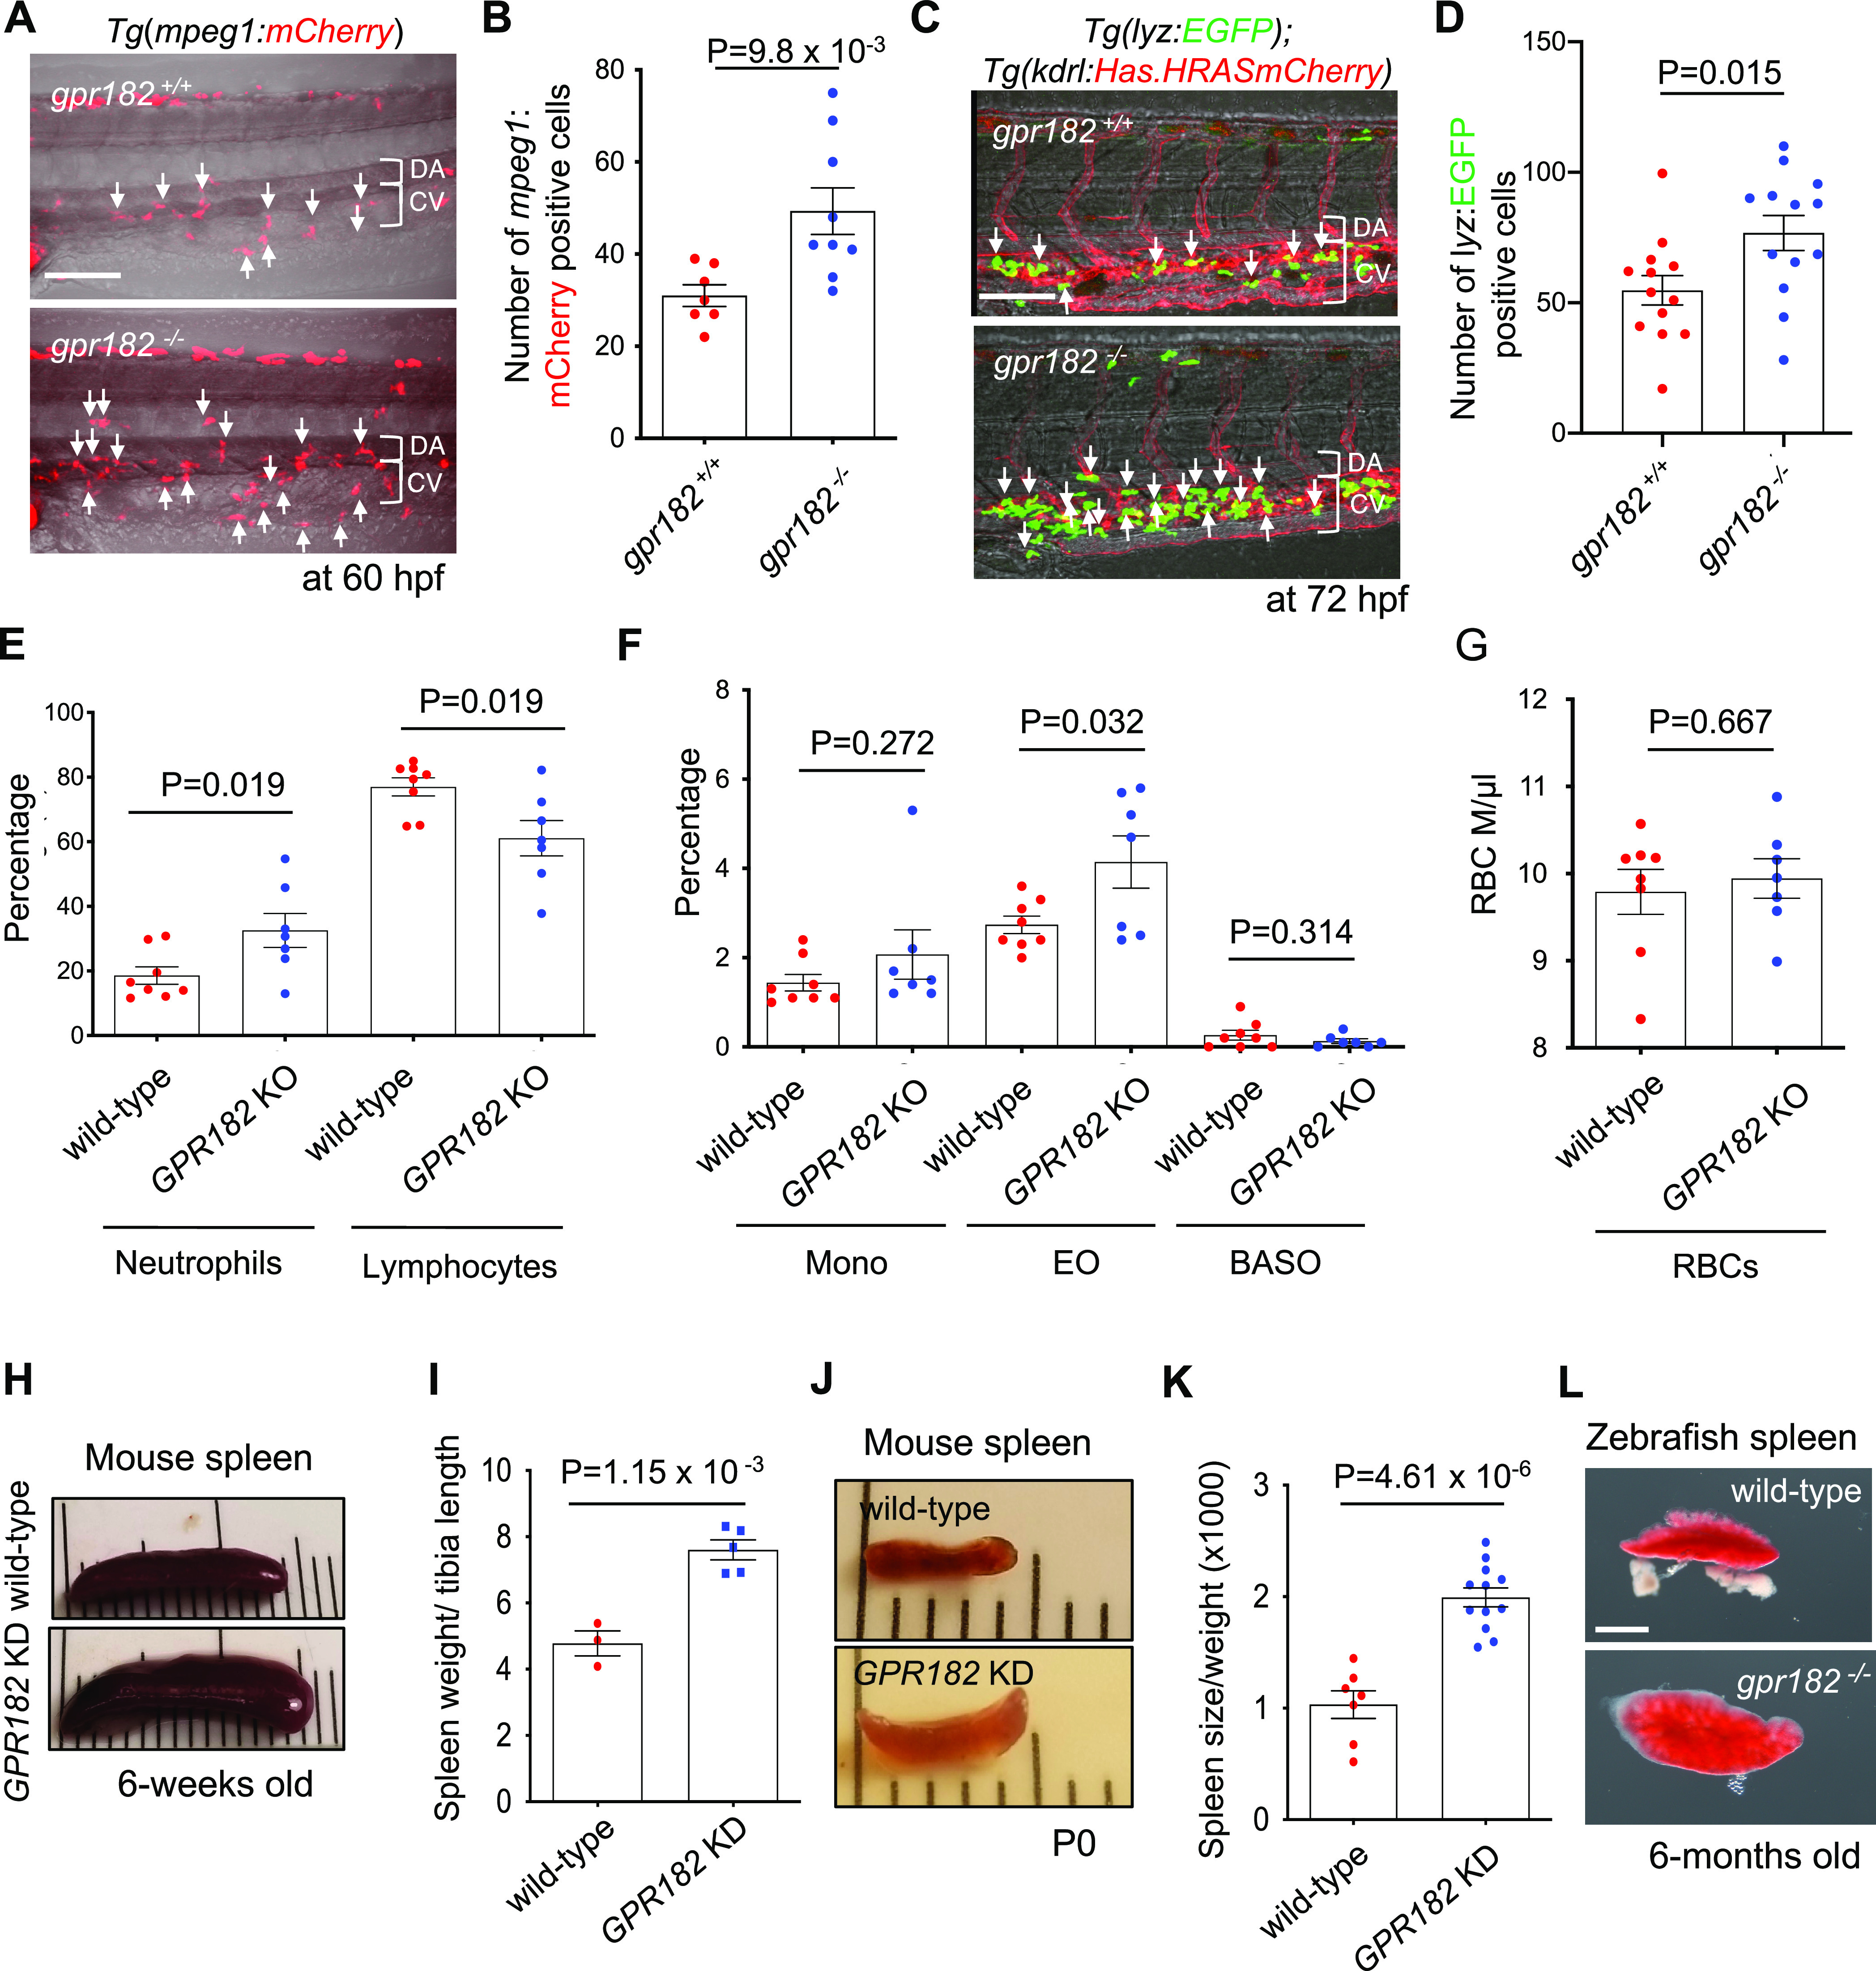
Figure 5.

Zebrafish and mouse gpr182 mutants exhibit an increased number of myeloid cells. (A) Confocal images of 60 hpf Tg(mpeg1:mCherry) wild-type and gpr182–/– embryos in the tail. White arrows point to mpeg1:mCherry positive cells. (B) Number of mpeg1:mCherry positive cells in tail (six somites). Wild-type (N = 7), gpr182–/–(N = 9), from three independent clutches. (C) Confocal images of 72 hpf Tg(lyz:EGFP); Tg(kdrl:Hsa.HRASmCherry) wild-type and gpr182–/– larvae in the tail. White arrows point to lyz:EGFP positive cells. (D) Number of lyz:EGFP positive cells in the tail (six somites). Wild-type embryos (N = 13), gpr182–/– embryos (N = 13), from three independent clutches. (E–G) Whole blood analysis of 6-week old C57/B6 wild-type (N = 8) and GPR182 KO (N = 7) mice. (H) Bright-field images of 6-weeks old wild-type and GPR182 KD mouse spleens. (I) Number of wild-type (N = 3) and GPR182 KD (N = 5) mouse spleen sizes. (J) Bright-field images of P0 wild-type and GPR182 KD mouse spleens. (K) Quantification of P0 wild-type (N = 7) and GPR182 KD (N = 11) mouse spleens. Spleen size was normalized by body weight and P0 wild-type spleen size was set at 1. Data are mean ± s.d. and a two-tailed Student’s t test was used to calculate p-values. (L) Bright-field images of 6-months old adult wild-type and gpr182–/– zebrafish spleen (see Figure S1D). Scale bars, 50 μm (A, C), 1 mm (D). BASO, basophils; CHT, caudal hematopoietic tissue; CV, caudal vein; DA, dorsal aorta; EO, Eosinophils; KD, knockdown; KO, knockout; MONO, monocytes; PCV, posterior cardinal vein; RBCs, red blood cells.
