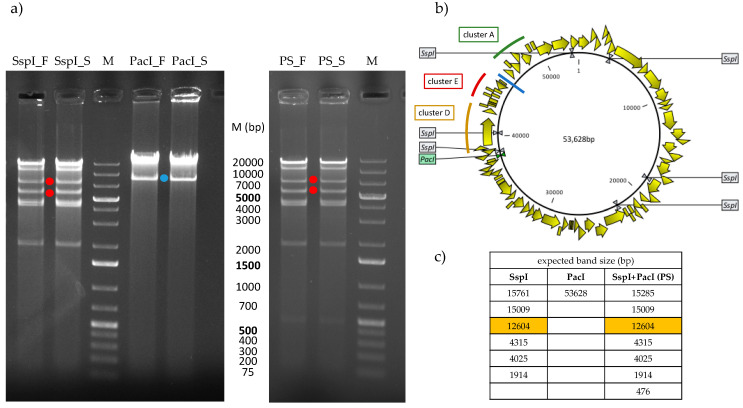
Figure A4.
(a) Restriction pattern of S144 DNA by using enzymes SspI, PacI (on the left) and the two enzymes together (PS; on the right). After each restriction, DNA has been denatured and cooled down to room temperature in a fast (F) or slow (S) way. The bands size of the marker (M) are indicated in the column in the centre between the two gels. Dots indicate not expected bands from DNA restriction with SspI (red) and PacI (light blue). (b) S144 genome with SspI and PacI restriction sites, clusters D, E and A and putative termini position (blue line) indicated. (c) Summary of the band size expected from restriction of circular DNA. In yellow, it is indicated the 12,604 bp band that is not present in the gels, between 40,301 bp and 52,905 bp, spanning over clusters E, A and B.

