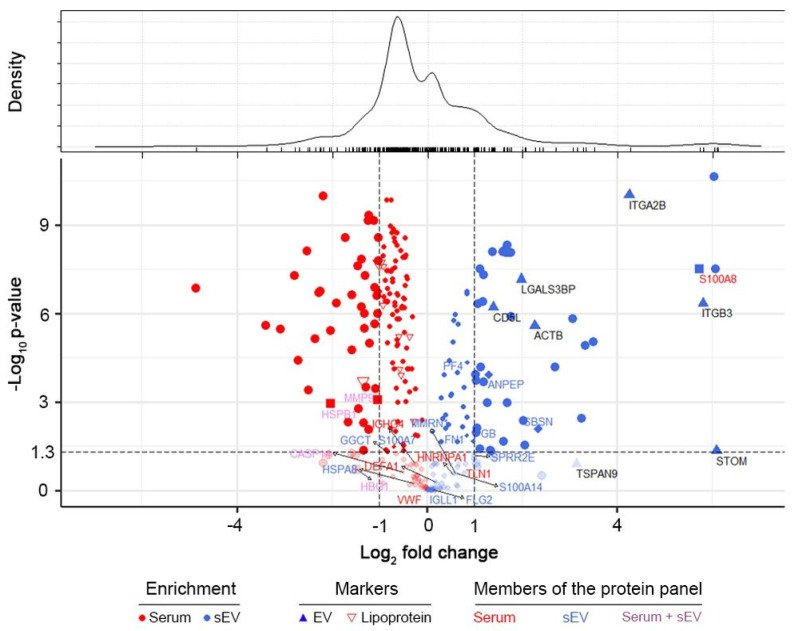
Figure 3.
Quantitative comparison of the proteome of sEV and whole serum samples. Volcano plot represents the observed changes in average MS intensities in paired sEV vs. serum comparisons. Protein enrichment is marked with red and blue colored symbols in whole serum and sEVs, respectively. Lipoproteins (empty red upside-down triangles), elements of our whole serum protein panel (red letters, square symbols), sEV protein panel (blue letters, diamond symbols) and common members of the two protein panels (purple letters) are highlighted. Values of –log (p) were obtained from paired Welch’s test in sEV/serum comparisons. Density estimation of log2 (fold change) values is shown on top.

