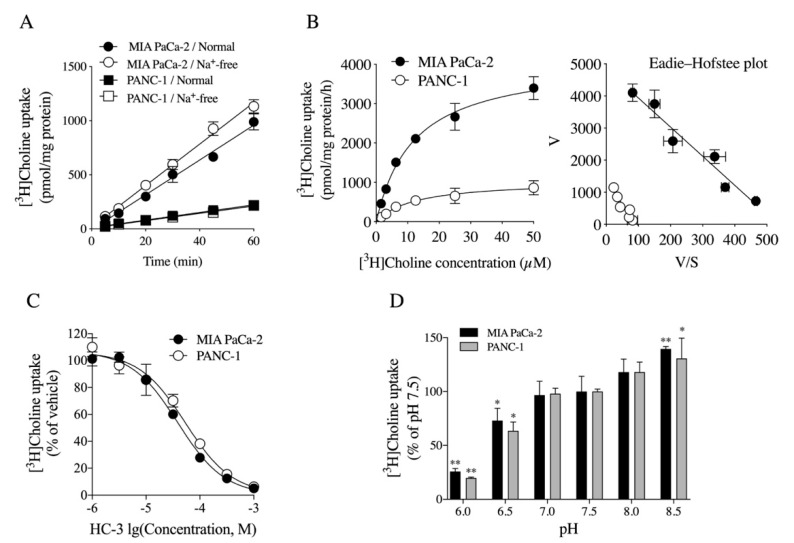
Figure 3.
Properties of choline uptake in MIA PaCa-2 and PANC-1 cells. (A) Time course and Na+ dependence of [3H]choline uptake (n = 4). Time course of [3H]choline uptake fitted using nonlinear-regression analysis. (B) Kinetic analysis of [3H]choline uptake in both cells (n = 4). Cells taken up with [3H]choline at concentrations of 1.56–50 µM for 20 min. Kinetic analysis of [3H]choline uptake calculated by Michaelis–Menten equation showed Km of 12.0 ± 1.4 µM and Vmax of 4120.0 ± 188.3 pmol/mg protein/h in MIA PaCa-2 cells and Km of 12.3 ± 3.3 µM and Vmax of 1045.0 ± 107.6 pmol/mg protein/h in PANC-1 cells. Eadie–Hofstee plot of [3H]choline uptake showing straight line in both cells (MIA PaCa-2 cells; R2 = 0.9524, p = 0.0009, PANC-1 cells; R2 = 0.8787, p = 0.0058). (C) Effects of choline-uptake inhibitor HC-3 on [3H]choline uptake in MIA PaCa-2 and PANC-1 cells (n = 4). Cells incubated with 1 µM to 1 mM HC-3 for 20 min and then 10 µM [3H]choline uptake measured for 20 min. IC50 value of HC-3 for inhibition of [3H]choline uptake in MIA PaCa-2 and PANC-1 cells was 39.1 µM and 54.2 µM, respectively. (D) Effect of extracellular pH on [3H]choline uptake in MIA PaCa-2 and PANC-1 cells (n = 4). Uptake of 10 μM [3H]choline measured for 20 min at different conditions from pH 6.0 to pH 8.5; * p < 0.05 and ** p < 0.01, and one-way ANOVA with Dunnett’s multiple-comparisons test compared to pH 7.5.

