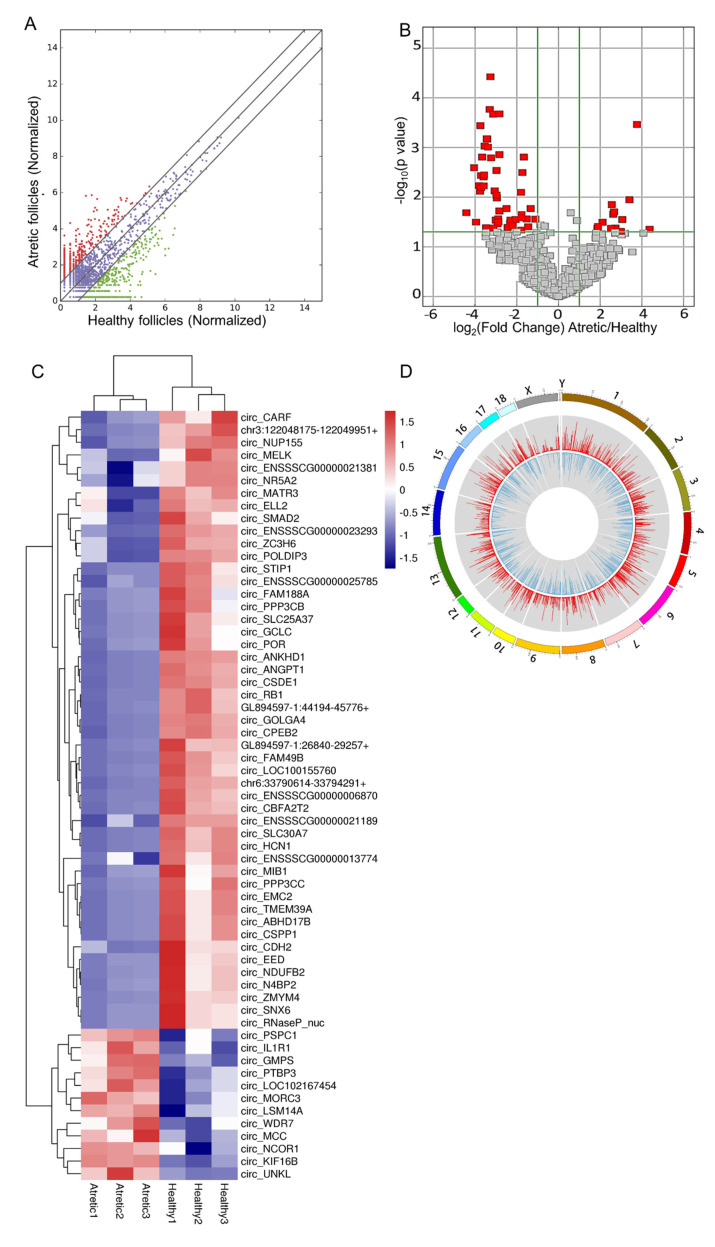
Figure 3.
Profiles of differentially expressed circRNAs (DE-circRNAs). (A) Scatter plot, assessing the overall distribution of DE-circRNAs between HA and AA follicles. Values on the horizontal and vertical axis represent the averaged normalized signal values of each group (log2 transformed). The red and green dots indicate circRNAs with fold change (FC) ≥ 2.0. (B) Volcano plot, visualizing the statistical difference of the DE-circRNAs. The horizontal axis represents the FC of detected circRNAs, and the vertical axis represents the p-value. The red dots in the plot denote the significantly different DE-circRNAs (FC ≥ 2.0 and p ≤ 0.05, respectively). (C) Hierarchical clustering, showing the expression profiles of all the DE-circRNAs. Rows represent circRNAs, while columns represent different samples. The circRNAs were classified according to Pearson correlation. (D) Circos plot, showing the distribution of DE-circRNAs on porcine chromosomes. From the outside to the inside, the circos plot was divided into three layers. The first layer indicated the chromosome map of the porcine genome, where the DE-circRNAs were located. The second layer with red bars denoted the mean expression levels of DE-circRNAs in AA follicles, while the third layer represented the average expression levels of DE-circRNAs in HA follicles. CDS, protein-coding exons. Follicles were isolated in batches at three different time points, each batch containing 15–20 ovaries.

