Figure 5.
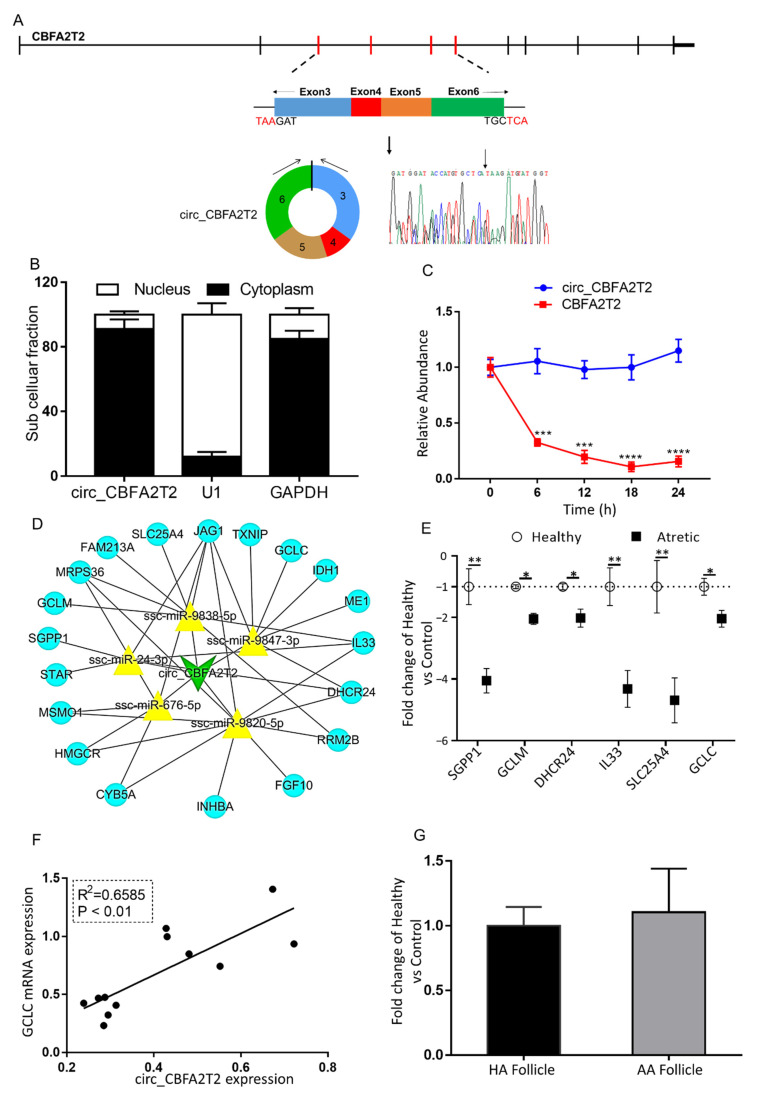
The characterization and putative role of circ_CBFA2T2. (A) The genomic loci of circ_CBFA2T2 in the CBFA2T2 gene. The expression of circ_CBFA2T2 was validated by qRT-PCR, followed by Sanger sequencing. Arrows represent divergent primers binding to the genome region of circ_CBFA2T2. (B) Cellular characterization of circ_CBFA2T2. Levels of nuclear control transcript (U1), cytoplasmic control transcript (GAPDH and mRNA), and circ_CBFA2T2 were assessed by qRT-PCR in nuclear (n = 3) and cytoplasmic (n = 3) fractions of porcine granulosa cells. Data are presented as a percentage of U1, GAPDH, and circ_CBFA2T2 levels. (C) qRT-PCR for the abundance of circ_CBFA2T2 (blue line, n = 3) and CBFA2T2 mRNA (red line, n = 3) in granulosa cells treated with actinomycin D at the indicated time points. (D) A putative ceRNA network of circ_CBFA2T2 constructed by Cytoscape 3.8. The green V shape represents circ_CBFA2T2, the yellow triangle represents targeted miRNAs, and blue circles denote targeted mRNAs. (E) qRT-PCR for the abundance of mRNA content of eight targeted genes in granulosa cells of HA (open circles, n = 6) and AA (filled squares, n = 6) follicles. (F) Association of expression levels of circ_CBFA2T2 and GCLC. (G) circ_CBFA2T2 expression in cumulus cells of HA (black bar, n = 6) and AA (grey bar, n = 6) follicles, as measured by qRT-PCR. Gene expression, as fold change of AA over HA follicles, with no change, was indicated as 1. *, p < 0.05; **, p < 0.01. Follicles were isolated in batches at three different time points, each batch containing 15–20 ovaries.

