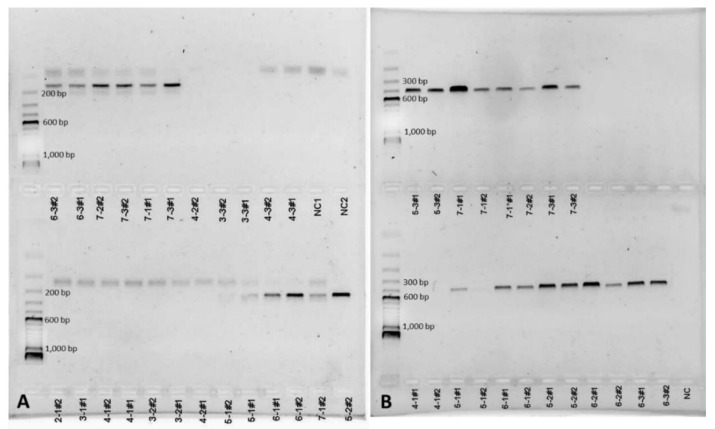
Figure 6.
Examples of PCR results obtained with both diagnostic primer pairs using soil DNA extracts (5–7 cm depth) from Antelope Acres west of EAFB. Amplicons obtained with primer pair ITSC1Af/r (~120 bp) (A). Amplicons obtained with primer pair EC3/EC100 (~500 bp). A 100 bp DNA ladder can be seen in the 2% agarose gel on the left (B) (PC = positive control, NC = negative control).

