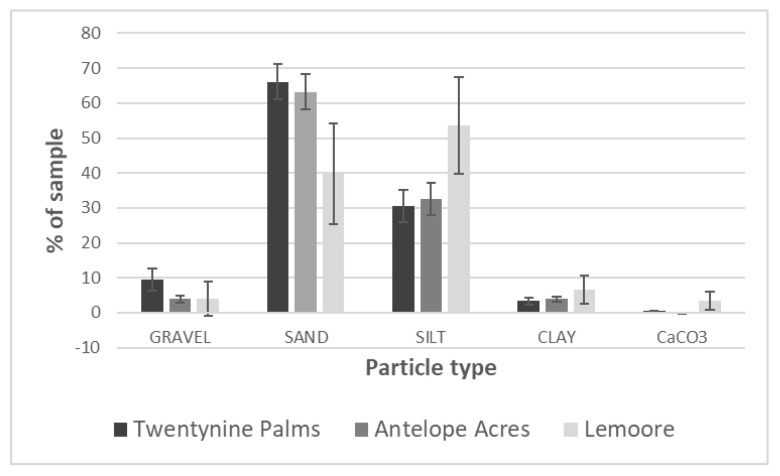
Figure 7.
Comparison of grain size analyses of representative soil samples from all three main sampling locations. The graph shows the percentage of each soil particle type in soils from the three locations investigated (n = 18 for Twentynine Palms, n = 12 for Antelope Acres, and n = 7 for Lemoore sites. Error bars represent 95% Confidence Intervals).

