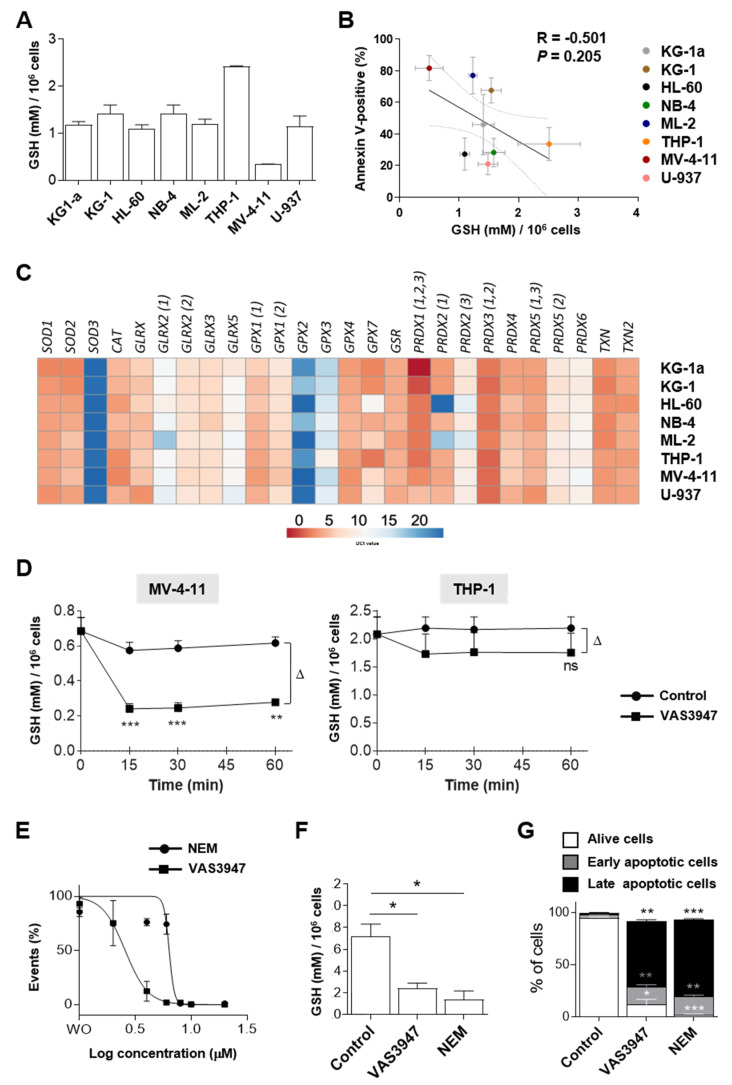
Figure 5.
Evaluation of physiological glutathione (GSH) and the effect of 4 µM VAS3947 on AML cell lines. (A) Levels of GSH in eight AML cell lines. GSH levels were detected based on Tietze’s method. Data are shown as mean ± SEM of n = 3 independent experiments. (B) Correlation between GSH levels corresponding to data presented in A and apoptosis level corresponding to data presented in Figure 1C in AML cell lines. (C) mRNA expression heatmap of 22 antioxidants assessed by RT-qPCR in the eight AML cell lines. Results are shown as the mean ∆Ct ± SEM of n = 3 independent experiments. Colors reflect expression levels as ∆Ct mean values (red: high expression, blue: low expression). Numbers within parentheses indicate detected gene variants. (D) Effect of 4 µM VAS3947 on intracellular GSH in MV-4-11 and THP-1 cell lines. Data are shown as mean ± SEM of n = 3 independent experiments. (E) Dose-response curve of VAS3947 and N-ethylmaleimide (NEM) for the MV-4-11 cell line and their IC50 (in µM) ± 95% CI. Data are shown as mean ± SEM of n = 3 independent experiments. (F) Comparing the GSH level in MV-4-11 cell line treated with either VAS3497 (4 µM) or NEM (8 µM). Data are shown as mean ± SEM of n = 3 independent experiments. (G) Comparing the apoptotic effects of VAS3497 (4 µM) and NEM (8 µM) on the MV-4-11 cell line. Data are shown as mean ± SEM of n = 3 independent experiments). Student’s t-test was performed for each cell line, comparing each treated condition to its corresponding control counterpart of individual time points (* p < 0.05; ** p < 0.01; *** p < 0.001). Δ: difference.

