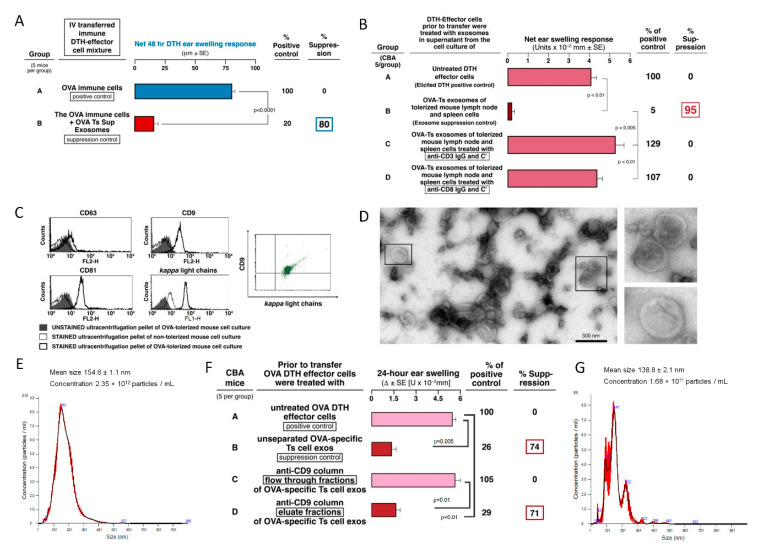
Figure 1.
OVA Ag-specific Ts cell-derived, CD9+ exosomes inhibit adoptive transfer of T cell mediated DTH. (A) OVA Ag-specific suppressor T cell-derived exosomes inhibit OVA-immune DTH effector cells (Group B, 80% suppression) undergoing adoptive transfer of DTH (Group A, immune response control). (B) Lymph node and spleen cells of Ag-tolerized mice failed to produce suppressive exosomes when depleted of CD3+ (Group C) and CD8+ (Group D) cell populations vs. their exosome suppression control (Group B, 95% suppression). (C) Flow cytometry showing that OVA-specific Ts cell-derived exosomes express CD9, CD63 (weakest expression), and CD81 tetraspanins, as well as antibody kappa light chains (left and center), and simultaneously co-express CD9 and antibody light chains (right). (D) OVA-specific suppressive exosomes were analyzed with transmission electron microscopy, that showed the presence of nanovesicles with bilamellar membranes. (E) Nanoparticle tracking analysis of OVA-specific Ts cell-derived exosomes to estimate their size and concentration. (F) OVA-specific suppressive exosomes were separated onto an anti-CD9-affinity chromatography column. The resulting anti-CD9 binding and non-binding exosome fractions were then used to treat OVA DTH effector cells prior to their adoptive transfer into naive recipients that 24 h later were challenged with OVA. The elicited DTH ear swelling responses were measured 24 h later with an engineer’s micrometer, showing that the full suppressive activity of the Ts cell-derived exosomes was in the anti-CD9 binding and eluted fraction (about 10% of the total) and there was no suppressive activity in the non-binding flow through fraction (Group D vs. C, 71% suppression vs. 0% suppression). (G) Nanoparticle tracking analysis of OVA-specific Ts cell-derived exosomes present in the eluate fraction resulting from separation onto an anti-CD9 affinity chromatography column, to estimate their size and concentration. Results of in vivo assays are shown as delta ± standard error (SE), one-way ANOVA with post hoc RIR Tukey test. n = 5 mice in each group or three samples in each experimental repetition.

