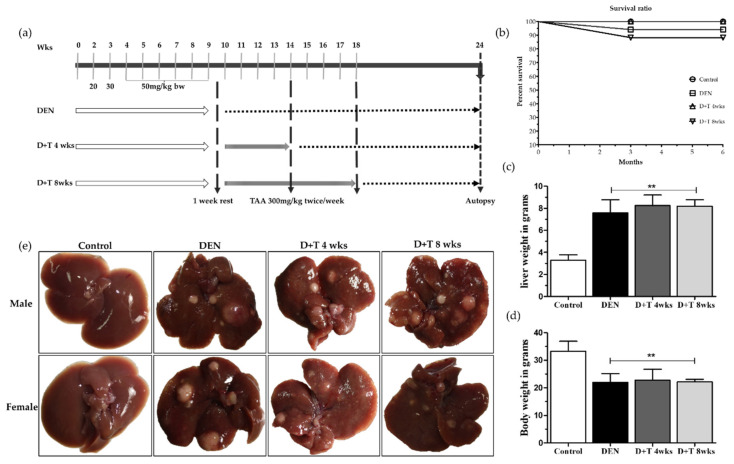
Figure 1.
A tumor development pattern in the animal model. (a) Grouping and schedule. (b) The survival ratio in all four groups at the end of the experiment. (c) Final body weight for all groups. (d) Relative liver weight for all groups. (e) Macroscopic view of representative images of mice livers 6 months after DEN administration. Data are presented as means ± SD. ** Significantly different from the control group (p < 0.01).

