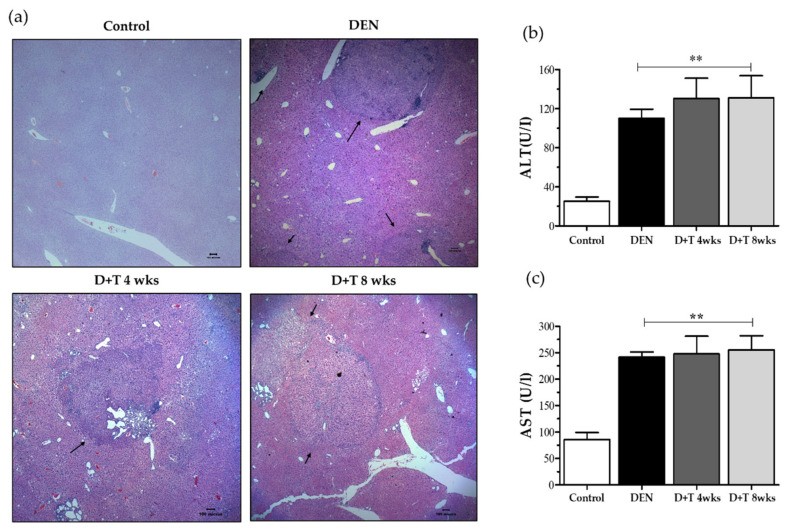
Figure 2.
Liver damage pattern. (a) Representative images of H&E staining from all groups after 6 months of DEN treatment (40×). Black arrows indicate tumors. (b) AST level in serum. (c) ALT level in serum. values are given as the means ± SD. At least three mice in each group were recorded. ** Significantly different from the control group (p < 0.01).

