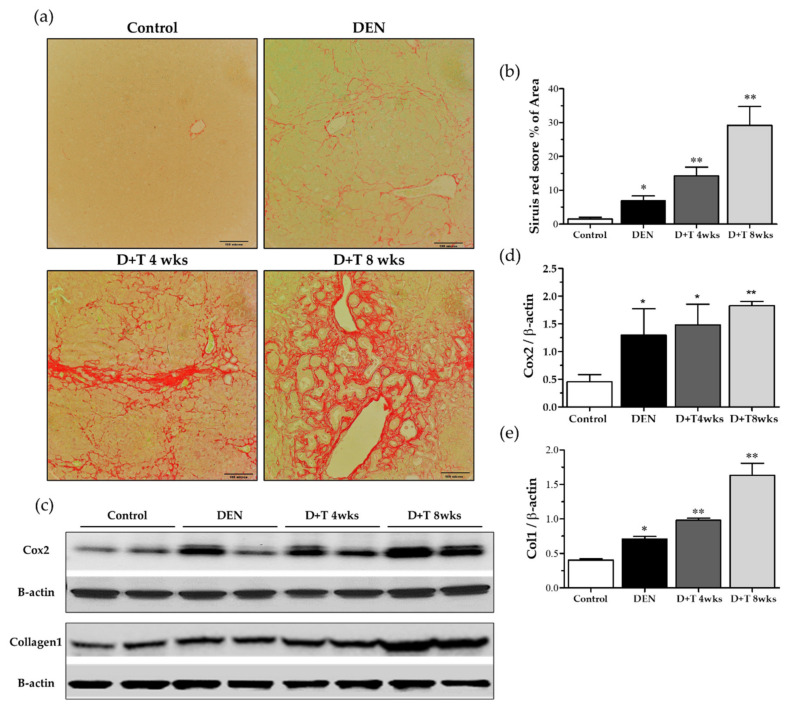
Figure 4.
Liver cirrhosis pattern. (a) Sirius red staining (200×) for each group. (b) Scoring of the Sirius red staining. (c) Collagen level and cox2 level by Western blot. β-actin was used as a loading control. (d,e) Quantitative analysis of collagen and Cox2 normalized with β-actin by the Image J software (NIH). * Significantly different from the control group (p < 0.05). ** Significantly different from the control group (p < 0.01).

