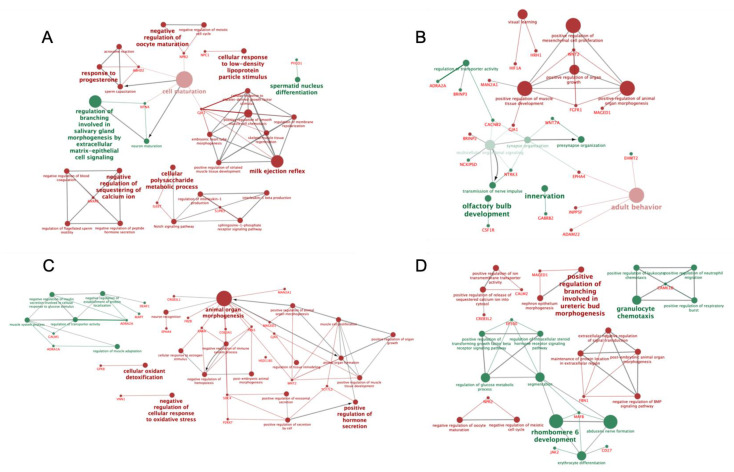
Figure 4.
Schematic representation of biologic terms and pathways of selected DEGs, among different mucosal segments of the sow endocervix (Cvx; (A)), endometrium (distal: D-Endom (B) or proximal: P-Endom (C)) and the utero-tubal junction (UTJ; (D) 24 h past copulation. The analysis of overrepresented functional categories was performed using the Cytoscape v3.0.0 application ClueGo v2.0.3. Terms are functionally grouped based on shared genes (kappa score) and are shown in different colors (green: up-regulated; red: down-regulated). The size of the nodes indicates the degree of significance, where the biggest nodes correspond to highest significance and the intensity of the nodes indicates the amount of genes involved in that specific term, where the more intense correspond to the highest number of genes found. The following ClueGo parameters were used: GO tree levels, 1–3 (first level = 0); minimum number of genes, 1; p-value correction, Benjamini–Hochberg, terms with p < 0.05, GO term connection restriction (kappa score), 0.4; GO term grouping, initial group size of 1. The resulting network was modified; that is, some redundant and non-informative terms were deleted and the network manually rearranged.

