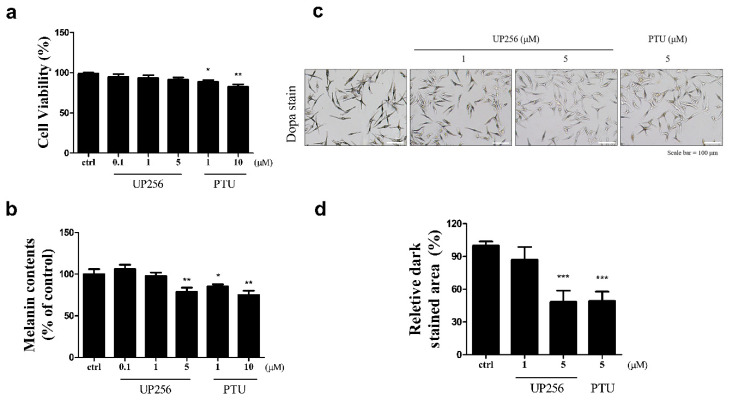
Figure 1.
Effects of UP256 on melanogenesis in NHEM. Cell viability (a) and melanin content were measured (b) after treatment with UP256 (0.1, 1, and 5 µM) for 72 h. PTU was used as a positive control. In situ tyrosinase activity in NHEMs was observed via L-DOPA staining (c). Scale bar = 100 µm. Relative amounts of stained area were measured with the ImageJ program. The results are calculated as a percentage of the vehicle-treated control (d) and expressed as mean ± SD of three independent experiments (* p < 0.05 ** p < 0.01, and *** p < 0.001, compared with the vehicle-treated control).

