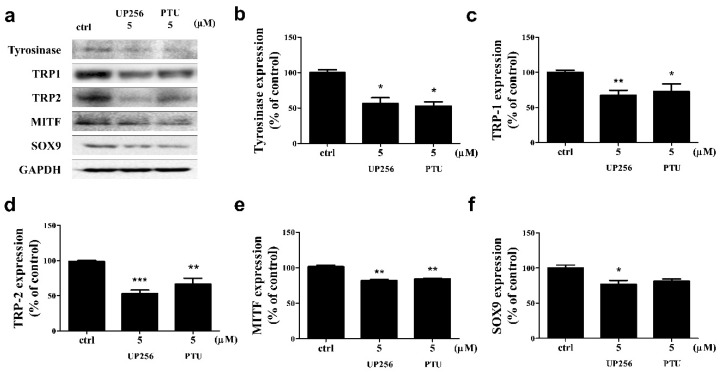
Figure 2.
Effects of UP256 on the expression of melanogenic pathway proteins. NHEMs were treated with 5 µM of UP256 and PTU for 72 h and analyzed using western blotting (a). Observed protein expression of tyrosinase (b), TRP-1 (c), TRP-2 (d), MITF (e), and SOX9 (f). The band intensities were quantified, and the integrated areas normalized, first to the corresponding value of GAPDH, and then to the signal observed in the vehicle-treated control. All data are presented as mean SD of three independent experiments. * p < 0.05, ** p < 0.01 and ***p < 0.001 compared with the vehicle-treated control.

