Figure 4.
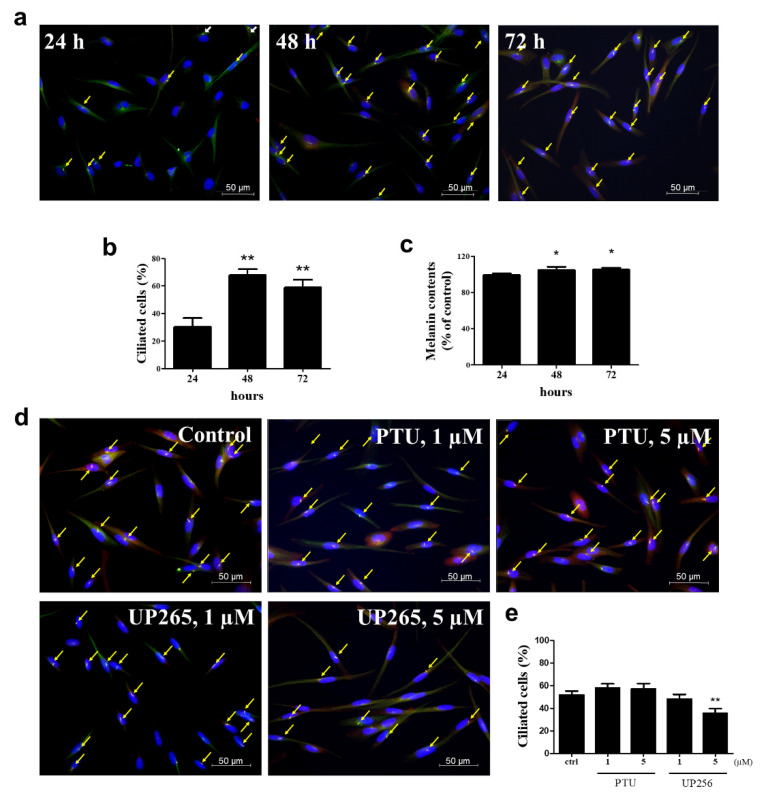
Analyses of primary cilia formation. (a) NHEM cells were incubated on cover glass for 24, 48, and 72 h. The cells were fixed and stained with antibody against Ac-tubulin (green) or Arl13b (red) and DAPI (blue). (b) The ciliated cells out of more than 500 cells were counted at the image overlaid with three fluorescence. Processing (such as changing brightness and contrast) was applied equally to the controls across the entire image. (c) Melanin contents. (d) NHEM cells were incubated on cover glass in the presence of 1 and 5 µM UP256 or PTU as a positive control for 72 h. Three fluorescence were overlaid to observe the primary cilium in each cell. Yellow arrows indicate the primary cilia in the representative fluorescence image for each group. (e) The ciliated cells out of more than 500 cells were counted at the image overlaid with three fluorescence. * p < 0.05 and ** p < 0.01.

