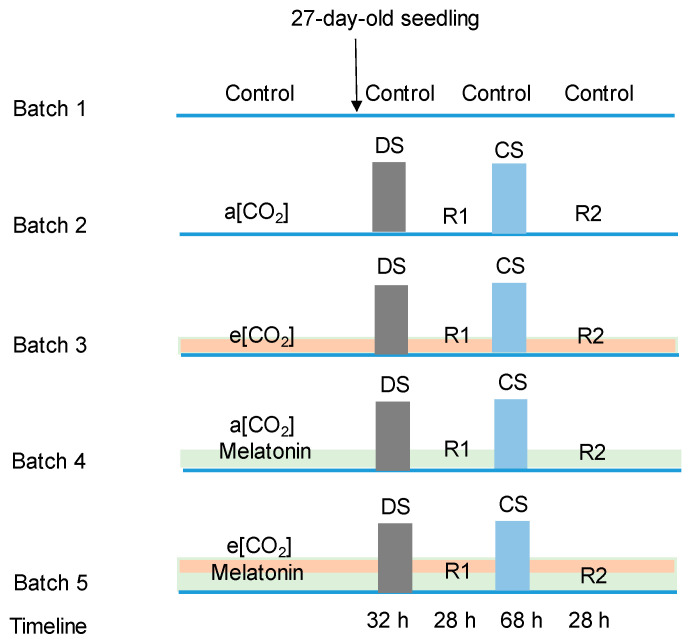
Figure 1.
Treatment flow of the experiments. “a[CO2]” and “e[CO2]” indicate 400 and 800 ppm CO2 concentration, respectively. The batch marked with “melatonin” indicates the plants were treated by seven times of 1 mM melatonin. “DS”, drought stress, 25/20 °C + no irrigation; “CS”, cold stress, 12/12 °C + irrigation; “R1” and “R2”, recovery, 25/20 °C + irrigation.

