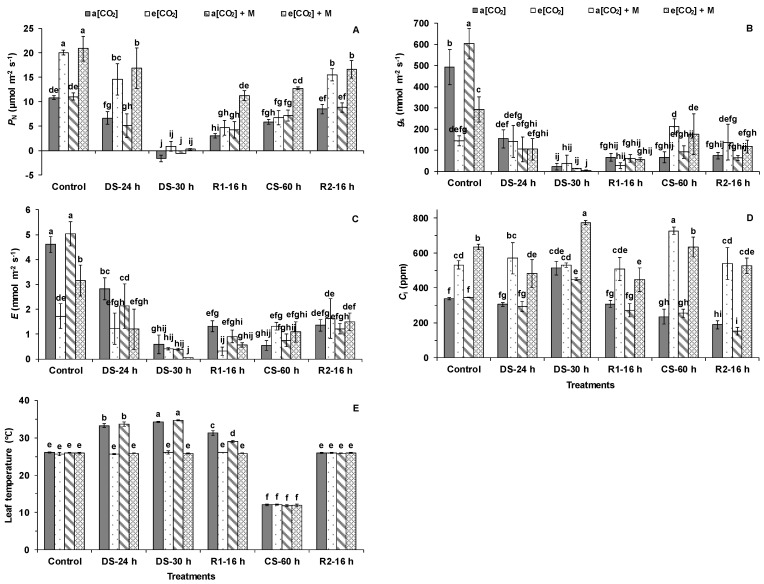
Figure 2.
(A) Net photosynthetic rate (PN), (B) stomatal conductance (gs), (C) transpiration rate (E), (D) intracellular CO2 concentration (Ci), and (E) leaf temperature in the first fully expanded leaves of tomato from the top during different treatments. “a[CO2]” and “a[CO2] + M” indicates 400 ppm CO2 concentration without and with melatonin application. “e[CO2]” and “e[CO2] + M” indicates 800 ppm CO2 concentration without and with melatonin application. “Control”, 25/20 °C + irrigation; “DS”, drought stress, 25/20 °C + no irrigation, “CS”, cold stress, 12/12 °C + irrigation; “R1” and “R2”, recovery, 25/20 °C + irrigation. The data represent average values ± SD (n = 3). The ANOVA was conducted within all the treatments at different stages. Different small letters showed significant differences (p < 0.05).

