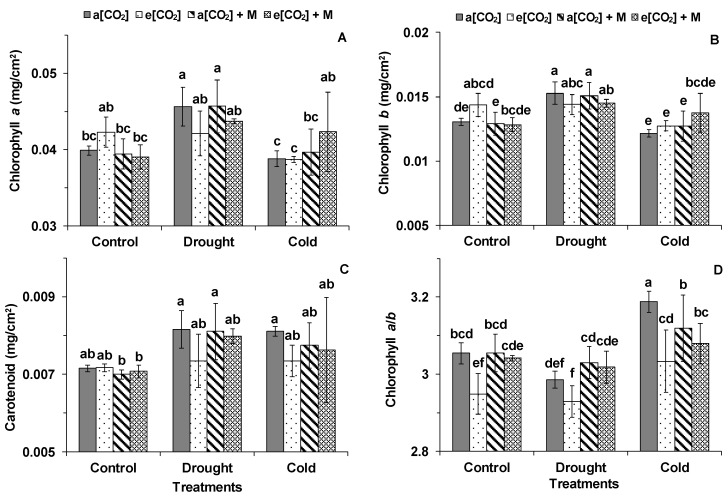
Figure 3.
(A) Chlorophyll a, (B) chlorophyll b, (C) carotenoid, and (D) chlorophyll a/b in the first fully expanded leaves of tomato from the top during different treatments. “a[CO2]” and “a[CO2] + M” indicates 400 ppm CO2 concentration without and with melatonin application. “e[CO2]” and “e[CO2] + M” indicates 800 ppm CO2 concentration without and with melatonin application. “Control”, 25/20 °C + irrigation; “Drought”, 25/20 °C + no irrigation for 30 h; “Cold”, 12/12 °C + irrigation for 60 h. The data represent average values ± SD (n = 3). The ANOVA was conducted within all the treatments. Different small letters showed significant differences (p < 0.05).

