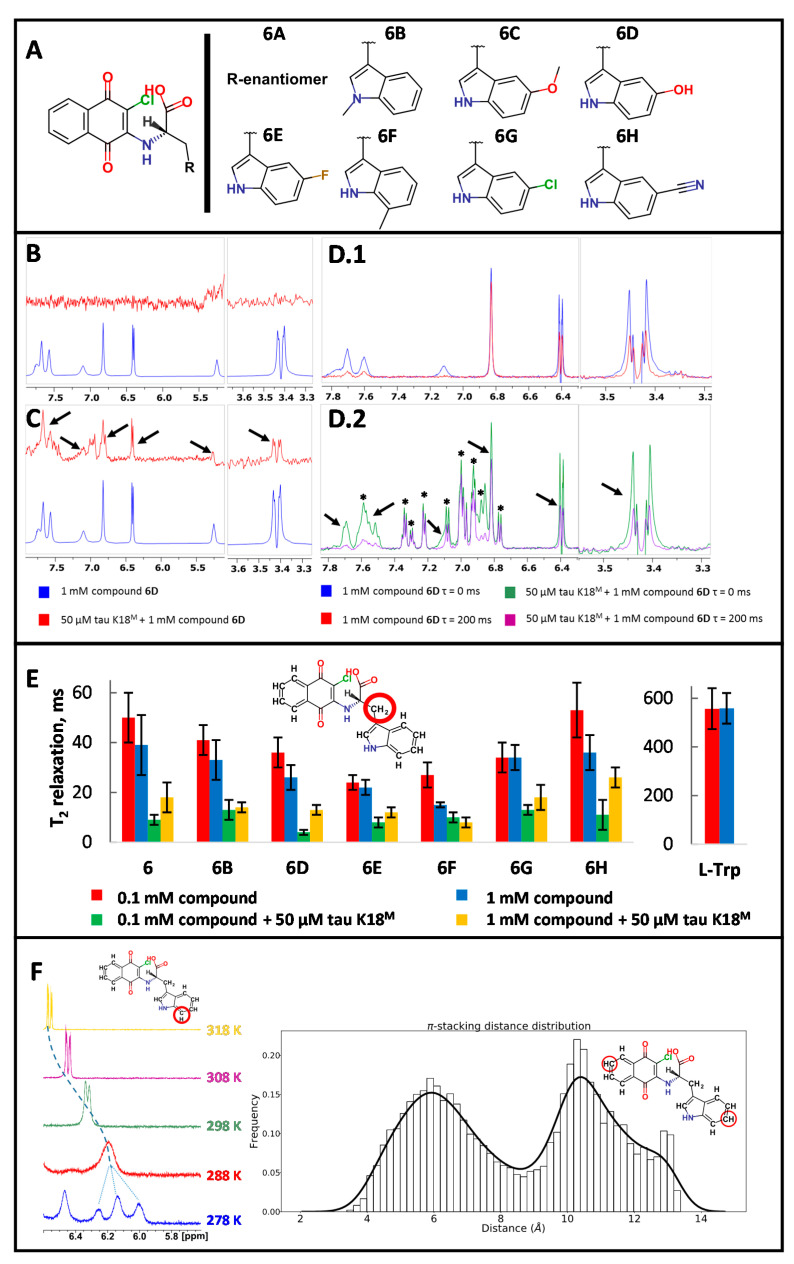
Figure 3.
1D ligand-observed NMR studies with Cl-NQTrp and its near neighbors (NNs). (A) Synthesized NNs of Cl-NQTrp. (B) Saturation transfer difference (STD) data (red) indicates no ligand-specific signals when compared to 1H reference spectrum (blue) for compound 6D. (C) Water–ligand observed via gradient spectroscopy (water-LOGSY) data (red) indicates ligand-specific peaks (black arrows) when compared to a 1H reference spectrum (blue) for compound 6D. (D) 1H Carr–Purcell–Meiboom–Gill (CPMG)-filtered data for compound 6D in the absence (D.1) and presence (D.2) of tau K18M (protein-derived peaks marked as ∗) indicates no IDP–ligand interactions using standard (200ms) relaxation delays as ligand-specific peaks (black arrows) decreased in intensity at a similar level after CPMG filter. (E) Comparison of T2 relaxation times for tryptophan methylene group (red circled) at different concentrations of compound 6 and its NNs in the presence or absence of tau K18M. L-Trp T2 relaxation times were measured without any protein present. (F) 1H NMR spectral changes for red-circled proton of Cl-NQTrp indicating decreasing intensity, coalescence, splitting, and sharpening of the signal with decreasing temperature indicating intermediate chemical exchange events (Left). Over a 1 µs simulation in explicit water, Cl-NQTrp adopts either folded or unfolded conformation close to 50% of the time (Right). Atom pair distance: 4 to 8 Å between the red-circled carbon atoms in folded and 9–13 Å in unfolded conformations.

