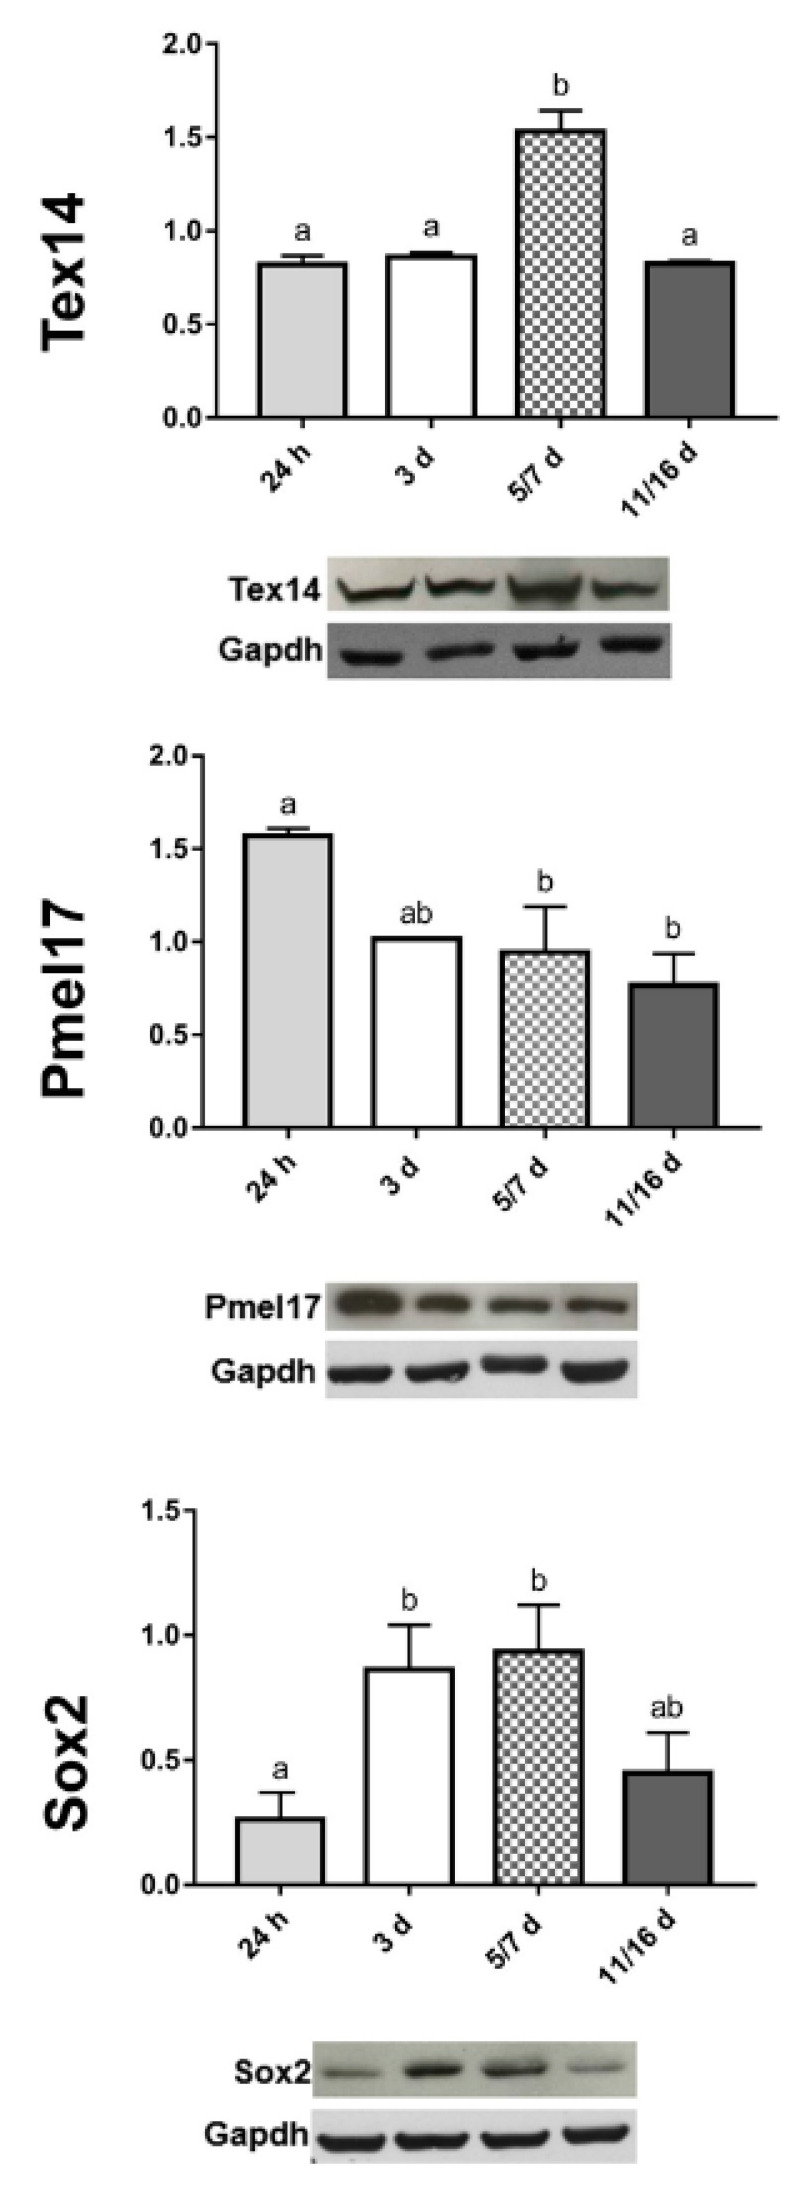
Figure 4.
Semiquantitative/quantitative analysis on spheroids. The graphs illustrate the expression levels of TEX14-intercellular bridge forming factor, the Pmel17 (amyloidogenic protein), and the Sox2-stemness marker, respectively, at different stages of spheroid formation. The data result from a densitometric analysis of the Western blots. The values are reported as relative optical density of the bands normalized to glyceraldehyde 3-phosphate dehydrogenase (GAPDH). Statistical differences were calculated by one-way ANOVA followed by Tukey’s post-hoc test; error bars represent SEM and different superscripts denote statistically significant differences (p < 0.01).

