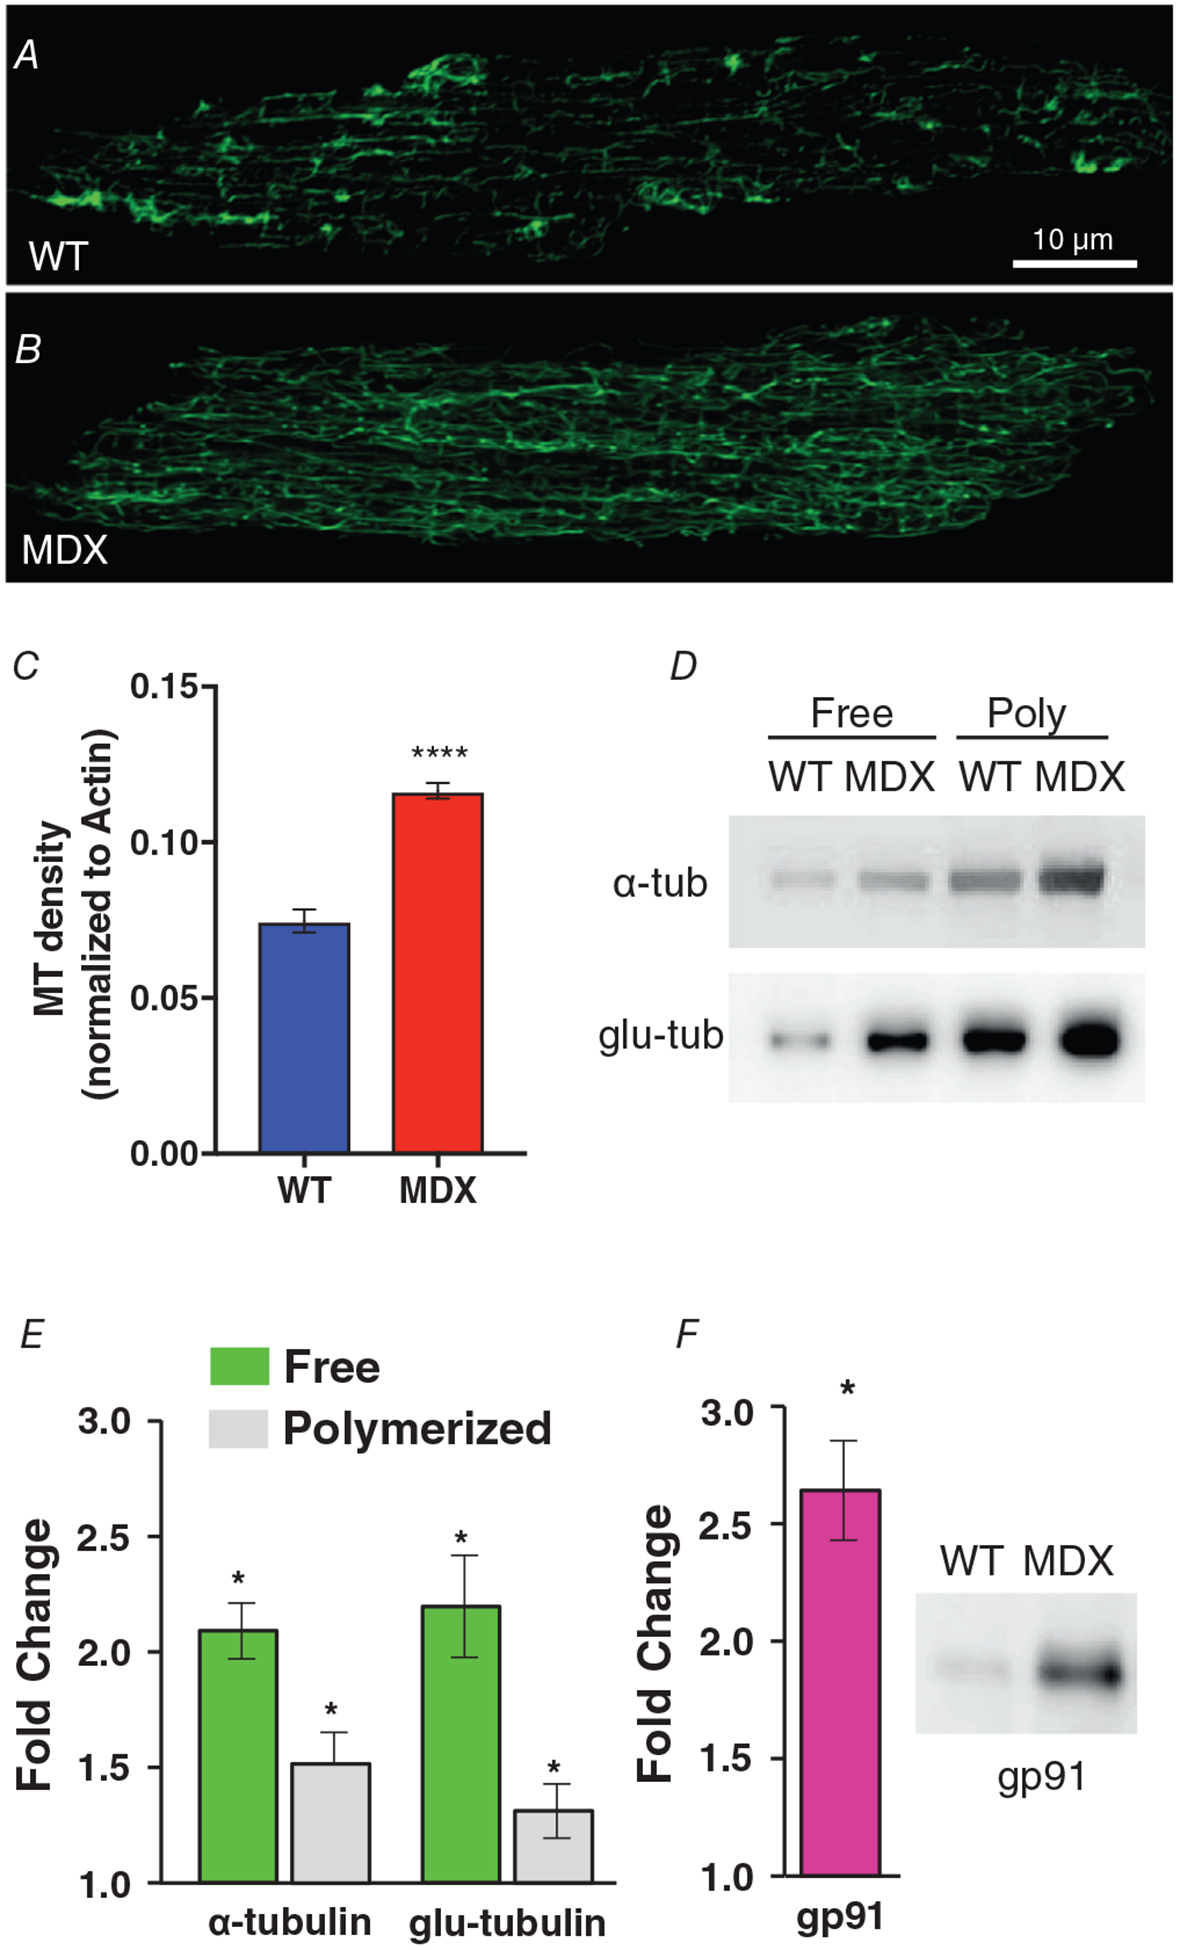
Figure 2. Microtubules in heart.

A and B, VCMs from WT (A) and MDX (B) hearts immunolabelled for α-tubulin. C, quantification of MT density was obtained by normalizing the skeletonized binary area of α-tubulin (A and B) over the binary area of actin (not shown). D, western blots for free and polymerized fraction of a-tubulin and glu-tubulin, respectively. E, quantification of western blot in MDX hearts showing the overexpression of tubulin proteins over WT hearts. F, western blots and quantification (fold change) for total gp91 expression in WT and MDX. ****P < 0.001, *P < 0.05 over WT group.
