
Figure 6. Modelling captures stretch-dependent Ca2+ spark behaviour in healthy and dystrophic heart.
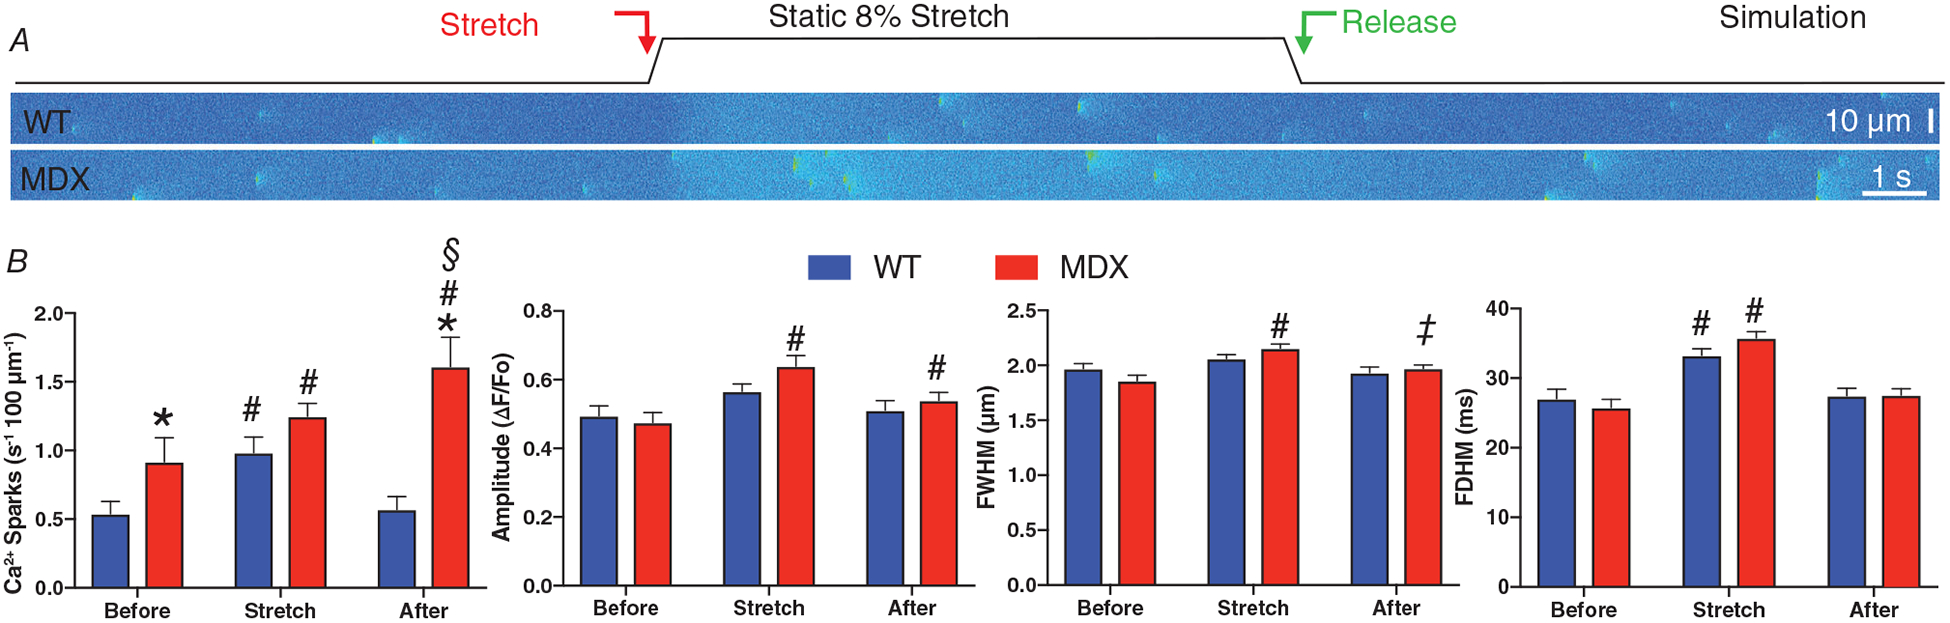
A, representative simulations of transverse confocal linescans for WT and MDX VCMs with an 8% stretch imposed at the red arrow. B, Ca2+ spark frequency, amplitude, FDHM and FWHM before, during and after a static, 8% stretch. Note, simulated transverse linescan frequencies have been adjusted (i.e. divided by 3) to enable direct comparison to experimental longitudinal linescan measures based on an average 600 nm and 1.8 μm inter-CRU distance, respectively. C, simulations of transverse confocal linescans for WT and MDX VCMs exposed to a cyclic, 2 Hz, 10 % stretch. Conditions as follows, WT (WT); MDX (MDX); MDX with 2-fold increase in X-ROS (MDX+); and MDX modified with ‘normalized’ (i.e, equivalent to WT levels) X-ROS components (MDX−). Statistics: MDX compared to WT (*P < 0.05), Stretch compared to Before (#P < 0.05), After compared to Before (§P < 0.05), and After compared to Stretch (‡P < 0.05).