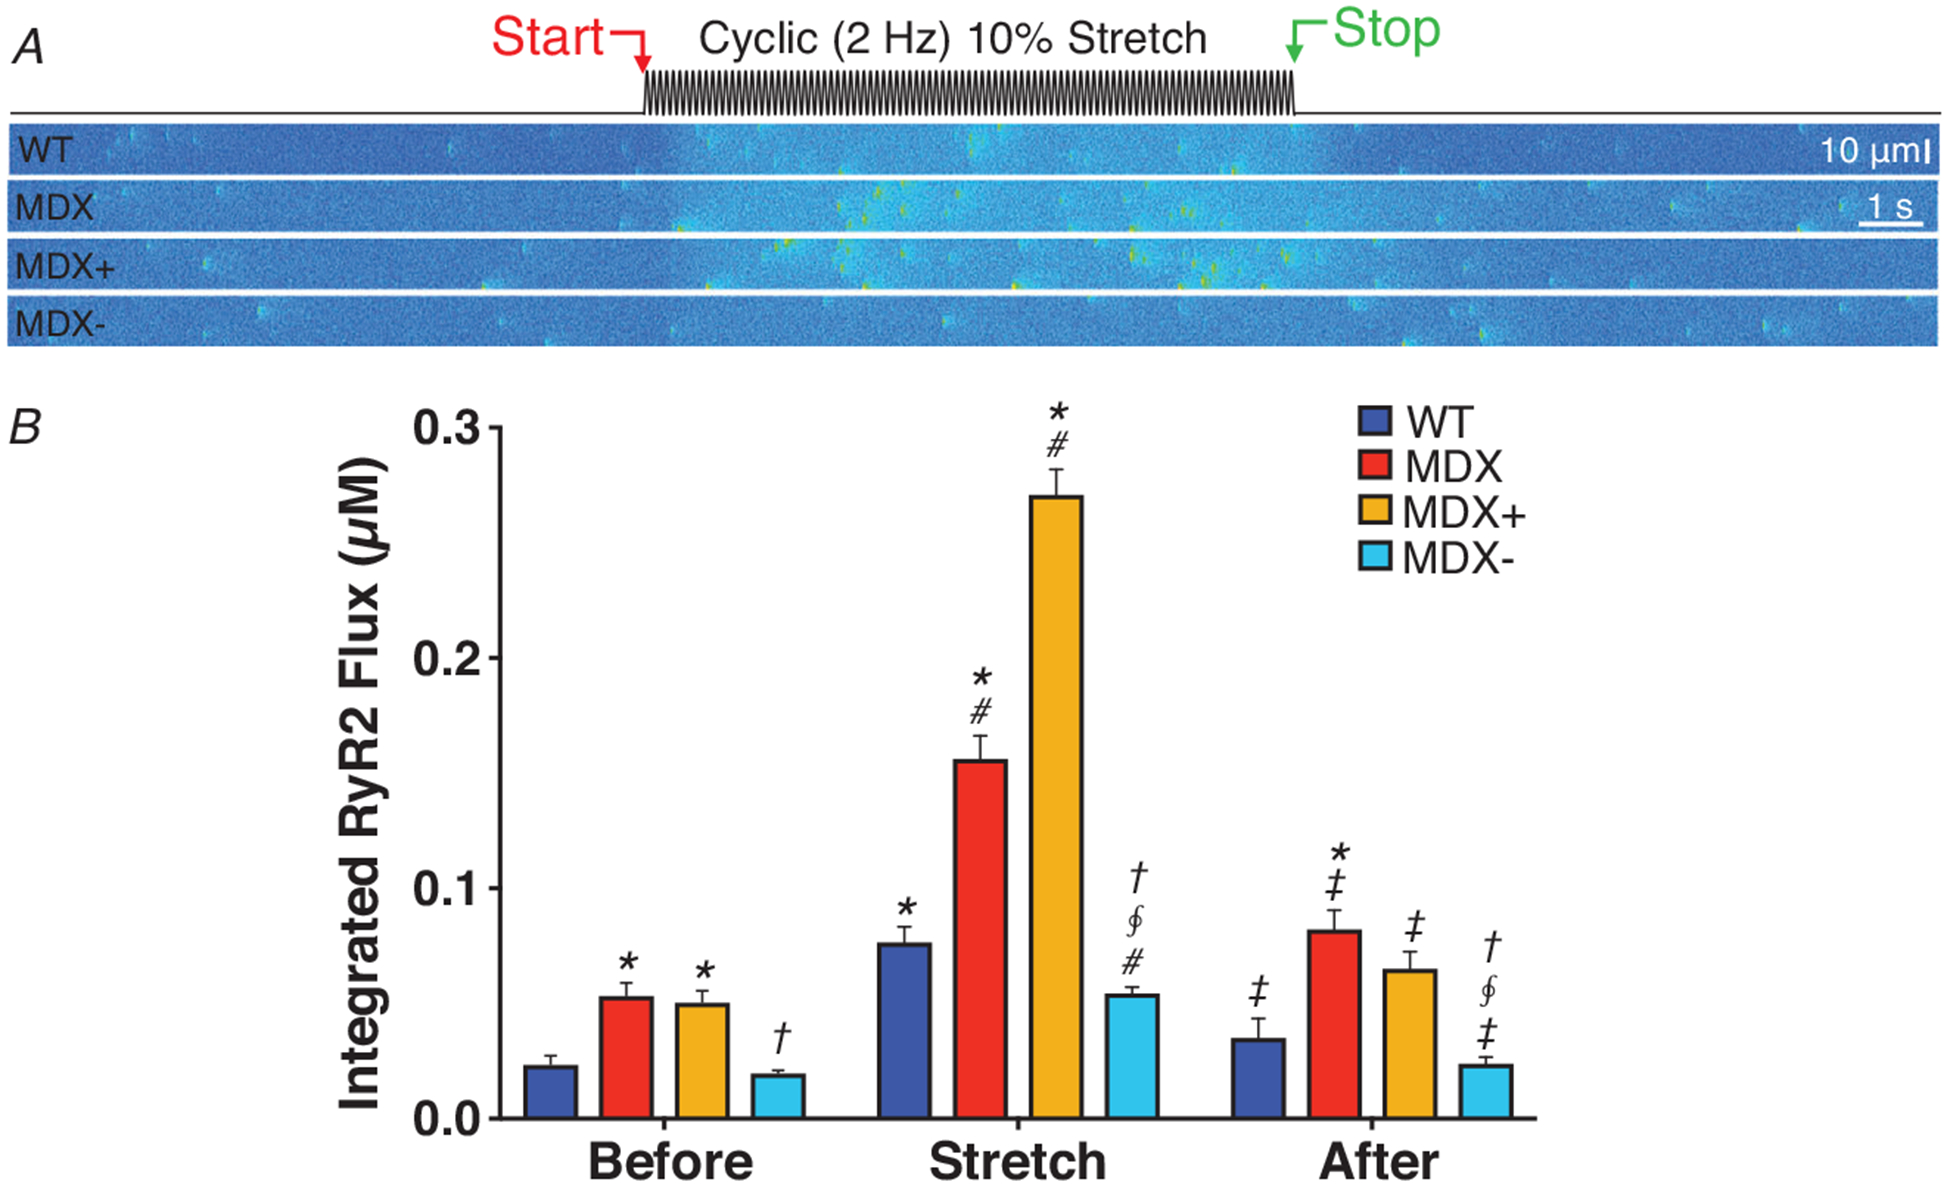
Figure 7. MT densification drives SR Ca2+ leak towards arrhythmogenic levels during cyclic stretch in heart.

A, simulations of transverse confocal linescans for WT and MDX VCMs exposed to a cyclic, 2 Hz, 10% stretch. Conditions as follows, WT (WT); MDX (MDX); MDX with 2-fold increase in X-ROS (MDX+); and MDX modified with ‘normalized’ (i.e, equivalent to WT levels) X-ROS components (MDX−). B, quantification of RyR release flux. Statistics: Test group (i.e. MDX, MDX+, MDX−) compared to WT (*P < 0.05) within each condition (i.e. Before, Stretch, After), MDX− compared to MDX+ within each condition (§P < 0.05), MDX− compared to MDX within each condition (†P < 0.05), Stretch compared to Before (#P < 0.05), and After compared to Stretch (‡P < 0.05).
