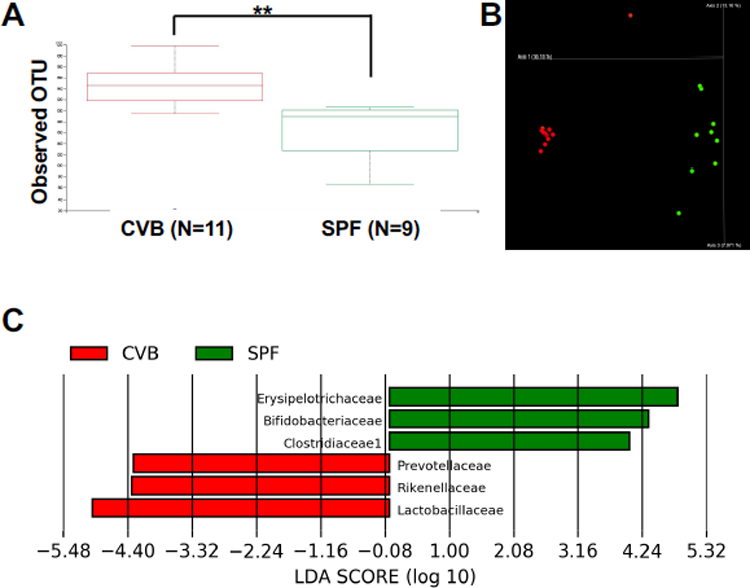
FIGURE 4.

Gut microbiota for CVB and SPF mice. A, 16S rRNA amplicon sequencing was performed on fecal samples from CByB6F1 mice of CVB (red) and SPF (green) facilities and the alpha diversity boxplots represent the significant difference in number of operation taxa units (OTUs) observed across the two housing conditions. The Kruskal-Wallis test was applied for statistical analysis. B, Microbiota OTUs from CVB and SPF mice formed two clusters by bray_curtis_emperor principle components analysis. C,16S rRNA amplicon sequencing data were further processed using the LefSe application to show highly differentially abundant taxa across the two housing conditions. These taxa were detected with very high LDA scores of > 4. **, P<.01.
