
Figure 3. Characteristic ssDNA-Seq profiles in vivo and in vitro for different sorts of SMnB evince non-B DNA structure formation.
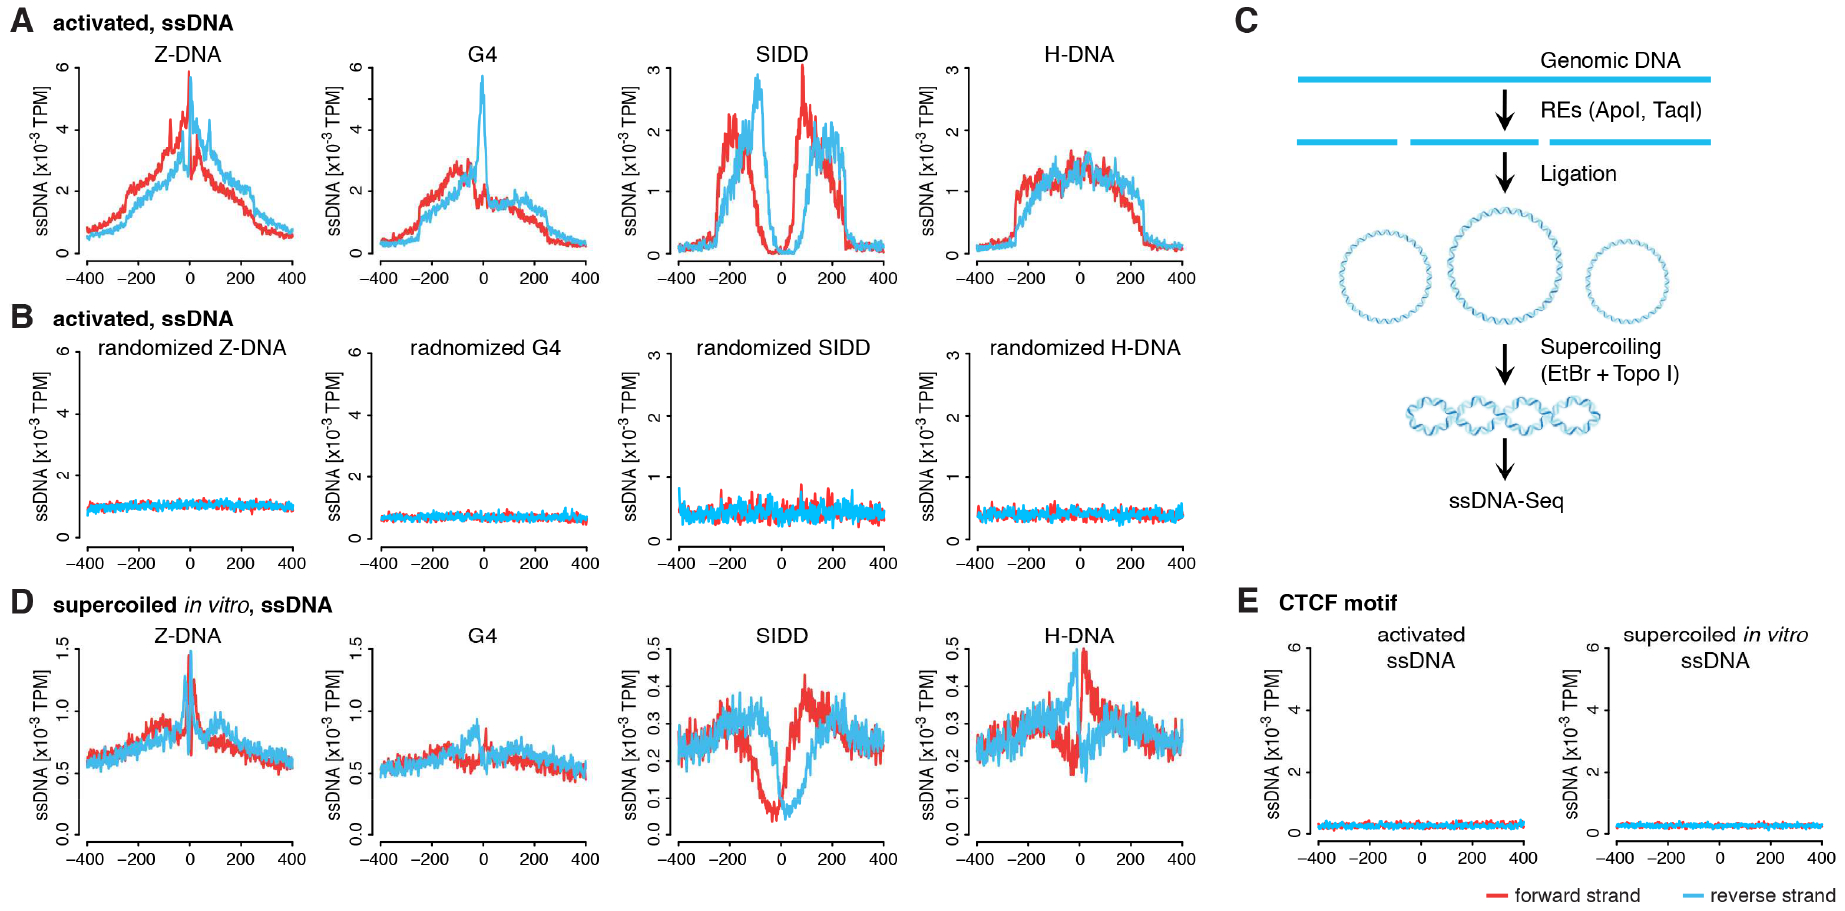
A) Composite profiles of ssDNA-Seq tags at SMnB enriched for ssDNA-Seq tags. The y-axis shows the normalized density of TPM along the x-axis numbered from the center of the aligned SMnB. Forward and reverse strand of ssDNA-Seq tags are shown in red and blue, respectively. SMnB near RNAPII binding sites were not included in this analysis. B) Composite profiles of ssDNA-Seq tags at random genomic locations near SMnB sites analyzed in (A). See also Figure S2A, S2B and S2C. C) Schema of whole genome supercoiling and subsequent ssDNA-Seq assay. D) ssDNA-Seq tag density profile from genome supercoiled in vitro at same SMnB as in (A). E) ssDNA-Seq tag distribution at CTCF binding sites in mouse activated B-cells and genome supercoiled in vitro.