
Figure 6. Non-B DNA at promoters and transcriptome characteristics.
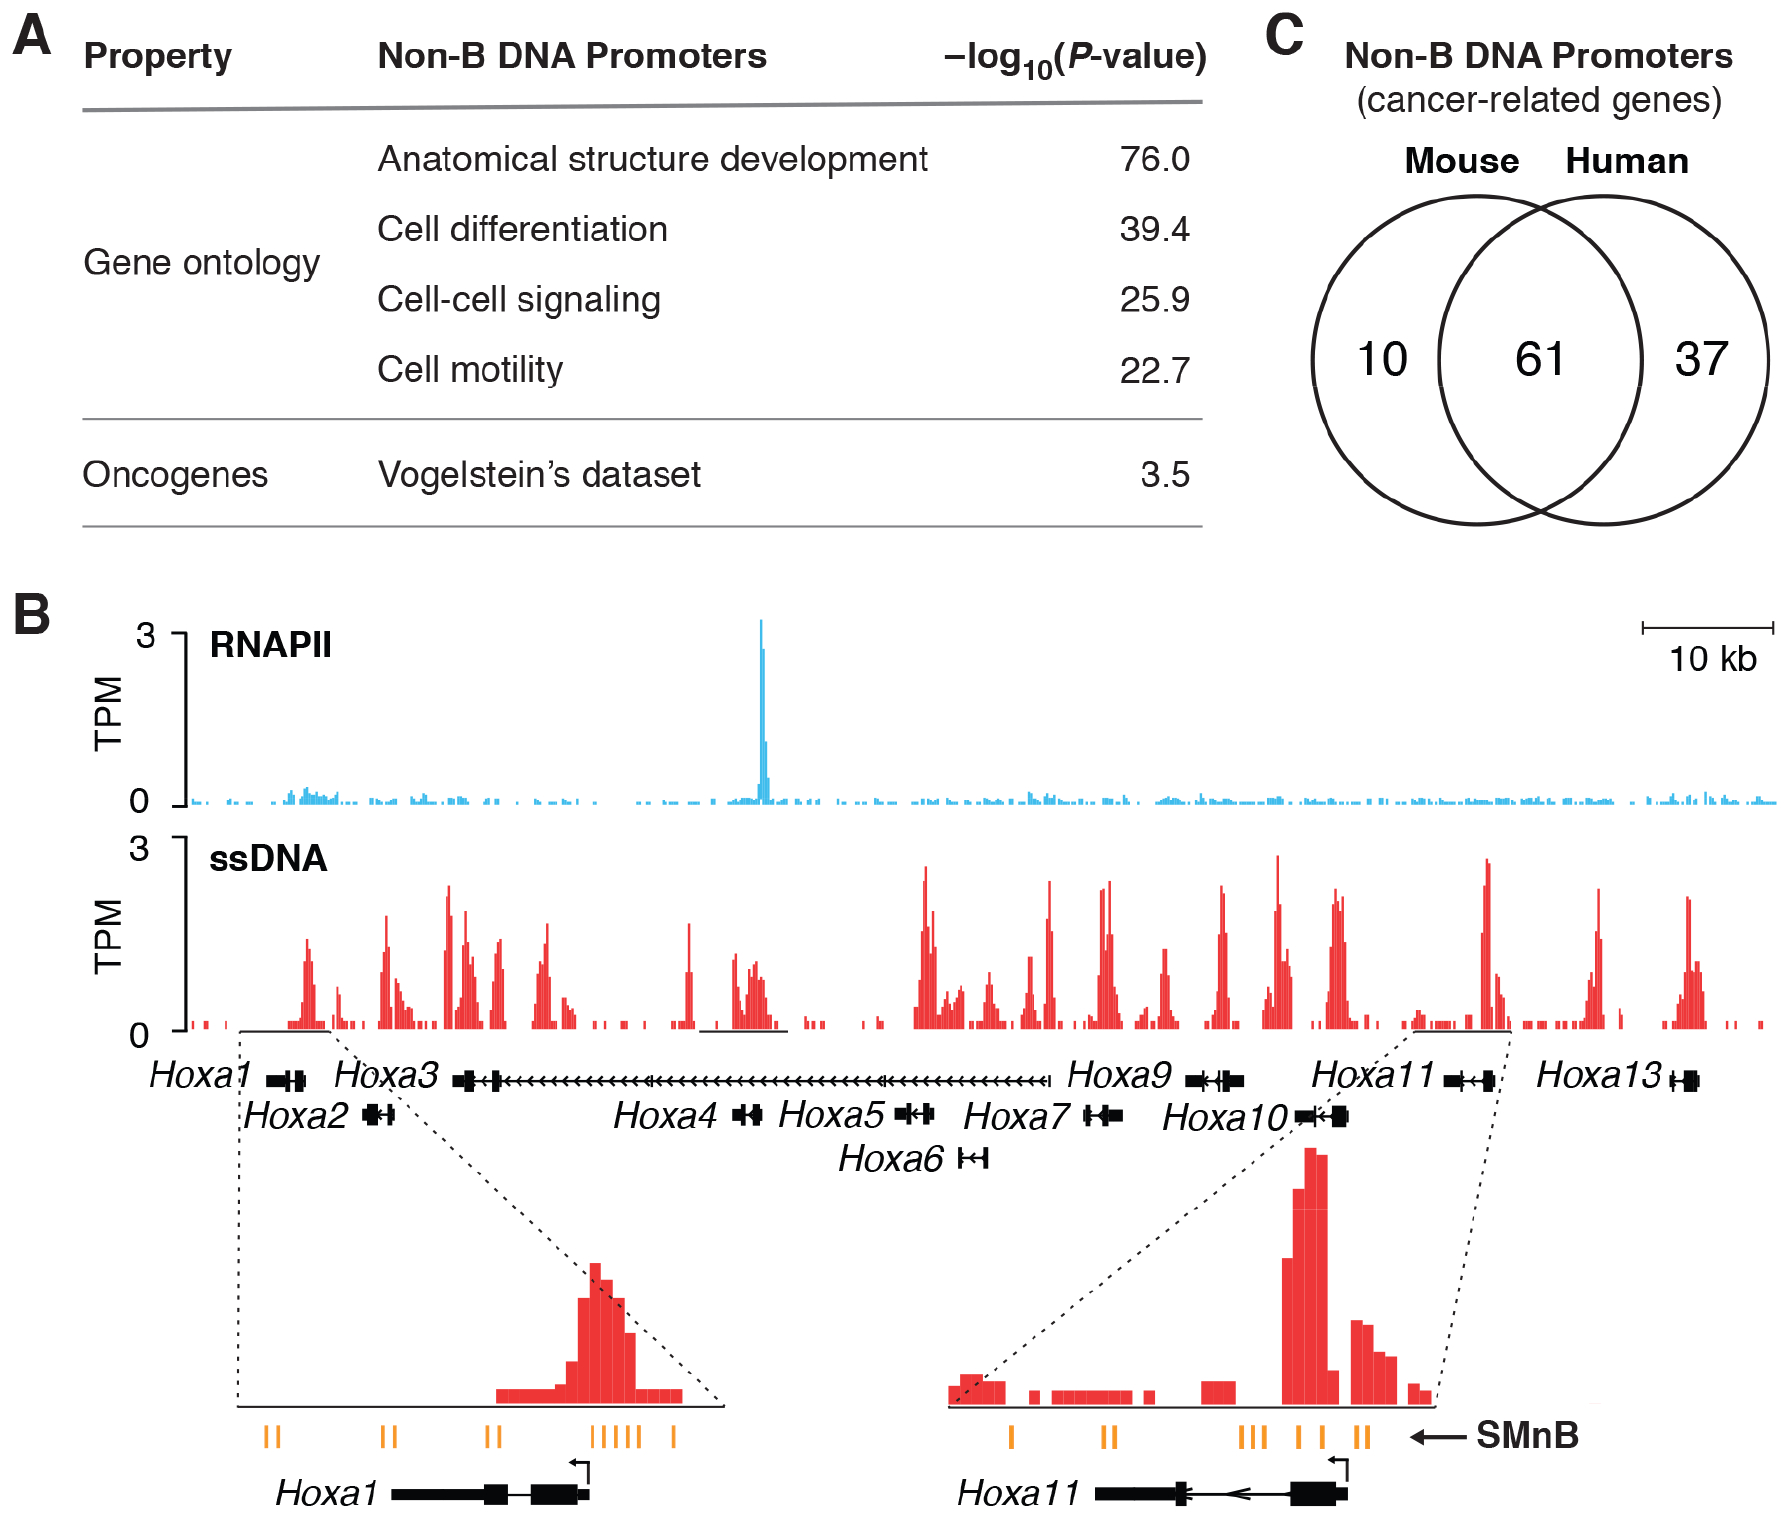
A) Non-B DNA structures in promoter regions is characteristic of developmental and cancer-related genes. Non-B DNA structures throughout promoters (−2 Kb to +0.2 Kb) were identified using the computational algorithm that enables analysis despite overlapping RNAPII binding (STAR Methods). Log of the p-value (probability that enrichment is fortuitous) is shown. See also Table S3. B) RNAPII ChIP-Seq profile overlaid with ssDNA-Seq signal at the HOXA cluster in the mouse activated B-cells genome. Transcriptionally silent HOXA genes show extensive ssDNA signal at SMnB that form different non-B DNA structures. C) Conservation of non-B DNA structures in mouse and human cancer-related genes. See also Figures S5 and S6, and Table S1.